


Three years ago I published an essay on the biological effects of wealth disparity titled Inequality of Wealth. Inequality of Health, which is reproduced below. It discusses the new (at the time) data on falling life expectancy of least-educated whites.
Since then we’ve seen more data and analyses that indicate that various segments of the American population are losing ground. A new analysis by Anne Case and Angus Deaton showed that mortality rates for white Americans aged 45–54 have risen since 1999. Unlike three years ago, when the news about falling life expectancies were not explicitly connected to rising inequality (see my 2012 post below), now the connection is routinely made, for example, by Joseph Stiglitz.
And the biological effects of inequality are not limited to increasing mortality. There is also an effect on the average population height. Two hundred years ago the Americans were the tallest nation on Earth. Today it’s not true. Worse, not only the average stature in the US is stagnating, shockingly, for some segments of the population it is decreasing. Here’s a graph based on the data in a 2010 article by John Komlos The recent decline in the height of African-American women:
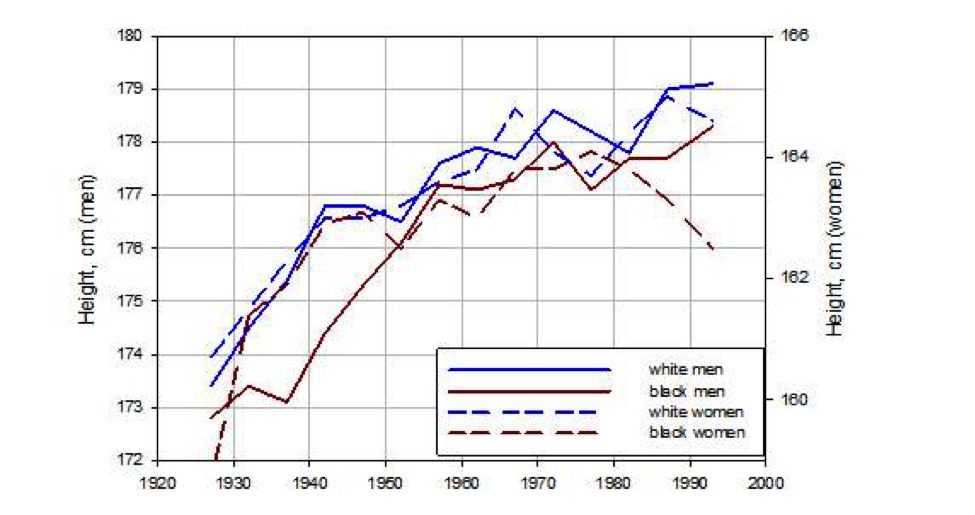
Because terminal height is largely determined during the first 20 years of life, I plot the data by year of birth plus 10 years, the midpoint of the 20-year interval.
As you can see, the average height of black women has declined since the late 1970s.
So, the life expectancy of white middle-aged males has declined, and the average height of black women has also declined. Is this the beginning of a more broadly based trend, in which the biological well-being of the “other half”—the 50 percent of the poorer Americans—will decline?
Inequality of Wealth. Inequality of Health
Two interesting news were reported this week. Forbes Magazine reported that the net worth of the wealthiest 400 Americans increased by 13 percent compared to last year. This is hardly surprising, since the magnitude of the top fortunes have been growing rapidly over the last 30 years.
Get Evonomics in your inbox
The second news, reported by New York Times’ Sabrina Tavernise, is “Life Spans Shrink for Least-Educated Whites in the U.S.” The real shocker is the magnitude of the shrinkage: between 1990 and 2008 the life expectancy of white women without a high school diploma declined by five years. At the same time white men who dropped out of high school lost three years of life. And we are not talking about a tiny group – Americans without a high school diploma constitute 12 percent of the population.
Are these two developments related? As far as I have seen most media reported them separately without making a connection. Tavernise, for example, discusses several possible explanations, but never comes to a conclusion. As she reports, “researchers offered theories for the drop in life expectancy, but cautioned that none could fully explain it.”
There are a multitude of possible proximate mechanisms explaining this drop in life expectancy (and Tavernise discusses many of them: more risky behaviors, overdoses from prescription drugs, smoking, less access to health care). But I would argue that the ultimate mechanism has to do with the growth of inequality in America over the last 30 years. So the two news stories are actually related. Incidentally, Tavernise never mentions the word ‘inequality.’
Inequality can take many forms. One is ‘categorical inequality,’ such as the discrimination on the basis of race or gender. This kind of inequality has been declining in the U.S. (although there is still much room for improvement). But at the same time different kinds of inequality, ‘quantitative’ rather than categorical, have been increasing.
One example is inequality in health, which could be measured by a variety of proxies, such as life expectancy. Life expectancy of the least educated white men is currently 67.5 years, while for men with a college degree or better it is 80.4 years. That is a gap of nearly 13 years. For white women the gap is just over 10 years. This is a really huge difference.
Another kind of ‘quantitative’ inequality is that of income or wealth. These two kinds of economic inequality are related. Clearly, one can acquire a great wealth only by enjoying large incomes (typically, over a number of years). Large wealth is also a source of income, when it is invested (and large fortunes always are). Because wealth and income are connected, trends in wealth and income inequality tend to move in parallel. In my research into the dynamics of economic inequality I tend to focus on wealth, because it is easier to quantify. For example, it is hard to trace income inequality in America for the period before the federal government began collecting income taxes (in 1913), but there are reasonably good data for the magnitude of top fortunes (so we can backproject the Forbes-type data to the nineteenth and even eighteenth century).
In particular, we know that during the nineteenth century the largest fortunes grew much faster than the median household wealth, culminating in a period known as the Gilded Age. We are currently living through what many commentators have called the ‘Second Gilded Age.’
But the two Gilded Ages were separated by a period when economic inequality was decreasing – roughly between 1910 and 1980. This period is sometimes called “the Great Compression.” So the dynamics of inequality in the US between 1800 and today were cyclic – up, then down, and now again up.
Interestingly, inequality in health was also cyclic, and its up- and down-trends closely trace the dynamics of economic inequality. Take a look at this graph from my forthcoming book on structural-demographic analysis of American history:

Long-term dynamics of life expectancies and average heights (stature) of native-born Americans
There are two measures of health here, life expectancy at age 10 and the average height. Around 1800 Americans were one of the healthiest nations on Earth. They certainly were the tallest (according to John Komlos and other researchers in the new discipline of anthropometrics). But during the nineteenth century, as economic inequality started to grow, common Americans began losing ground. By the end of the century they lost about 8 years of life expectancy and 4 cm (almost 2 inches) of average height.
Why do I treat this trend as one of increasing health inequality? Because, at least for stature, we have data for both average Americans and those who were better off. At the same time that the height of an average army recruit was declining, the heights of West Point cadets (who came from more privileged backgrounds) were actually growing. Because there are many more common Americans than the elites, the trajectory of the average height reflected the declining standards of life of the majority of people rather than the good health of the small proportion, the elites.
During most of the twentieth century (before 1980), as economic inequality declined, both health indices grew explosively. Americans regained their status as the tallest nation. Then came the turning point of 1980. The graph above does not really show what happened after 1980, because it is based on data published during the 1990s. But studies examining health indices in recent decades suggest that trends are not particularly encouraging. For example, John Komlos and co-author Marieluise Baur recently published an article with the telling title: “From the Tallest to (One of) the Fattest: The Enigmatic Fate of the American Population in the 20th Century.” In the abstract, they write that today:
the Dutch, Swedes, and Norwegians are the tallest, and the Danes, British and Germans – even the East-Germans – are also taller, towering over the Americans by as much as 3-7 cm. Americans also live shorter. The hypothesis is worth considering that this adverse development is related to the greater social inequality, an inferior health-care system, and fewer social safety nets in the United States than in Western and Northern Europe, in spite of higher per capita income.
And this brings me back to the report on the declining life expectancy for high-school dropouts. Historical data show that rampant economic inequality results in declining standards of life for the least advantaged segments of the population. This is what happened during the nineteenth century in America, and, apparently, this is what is happening today.
4 January 2016
Donating = Changing Economics. And Changing the World.
Evonomics is free, it’s a labor of love, and it's an expense. We spend hundreds of hours and lots of dollars each month creating, curating, and promoting content that drives the next evolution of economics. If you're like us — if you think there’s a key leverage point here for making the world a better place — please consider donating. We’ll use your donation to deliver even more game-changing content, and to spread the word about that content to influential thinkers far and wide.
MONTHLY DONATION
$3 / month
$7 / month
$10 / month
$25 / month
You can also become a one-time patron with a single donation in any amount.
If you liked this article, you'll also like these other Evonomics articles...
BE INVOLVED
We welcome you to take part in the next evolution of economics. Sign up now to be kept in the loop!
