


April 14, 2021
By Steve Roth
You hear a lot about bottom-up and middle-out economics these days, as antidotes to a half-century of “trickle-down” theorizing and rhetoric. You’re even hearing it, prominently, from Joe Biden.
They’re compelling ideas: put more wealth and income in the hands of millions, or hundreds of millions, and you’ll see more economic activity, more prosperity, and more widespread prosperity. To its proponents, it seems deeply intuitive or even obvious, a formula for The American Dream.
But curiously, you don’t find much nuts and bolts economic theory supporting that view of how economies work. There’s been lots of research on the sources and causes of wealth and income concentration. There’s been a lot of important work on the social and political effects of inequality — separate (though tightly related) issues. But unlike the steady stream of “incentive” theory from Right economists over decades, Left and heterodox economists have largely failed to ask or answer a rather basic theoretical (and empirical) question: what are the purely economic effects of highly-concentrated wealth, held by fewer people, families, and dynasties, in larger and larger fortunes?
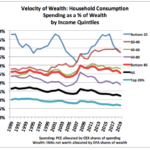
In a new paper and model published in Real-World Economics Review, I try to tackle that question. The model takes advantage of national accountants’ wealth measures that have only been available since 2006 or 2012 (with coverage back to 1960), and measures of wealth distribution that were only first published in 2019. Combined with thirty+ years of consistent survey data on consumer spending at different income levels, the paper derives a novel economic measure: velocity of wealth.
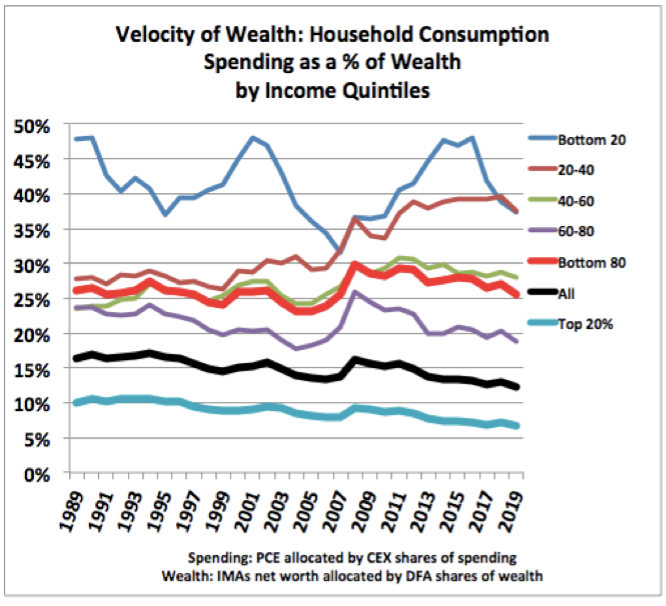
The top 20% only turns over 5% of its wealth each year in spending. The bottom 80% turns its wealth over five times as fast (25% a year). The arithmetic takeaway: at a given level of wealth, more broadly distributed wealth means more spending: the very stuff of economic activity, which is itself the ultimate source of wealth accumulation.
The details of the model are somewhat more complex, but it only employs five easy to understand formulas — all basically just arithmetic, and all expressed without resort to abstruse symbols; they use plain language. The model only depicts one economic effect, the wealth-velocity/spending effect (there are innumerable others), but it’s an effect that’s completely ignored in economics modeling. (Keynes’ consumption function doesn’t even have a wealth term.)
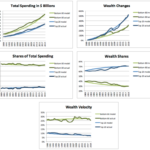
How good are the model’s predictions? It starts with just two numbers in 1989 — the wealth of the top 20% and the bottom 80% — and extrapolates forward using those few formulas to predict levels of wealth, spending, and shares of wealth and spending, thirty years later.
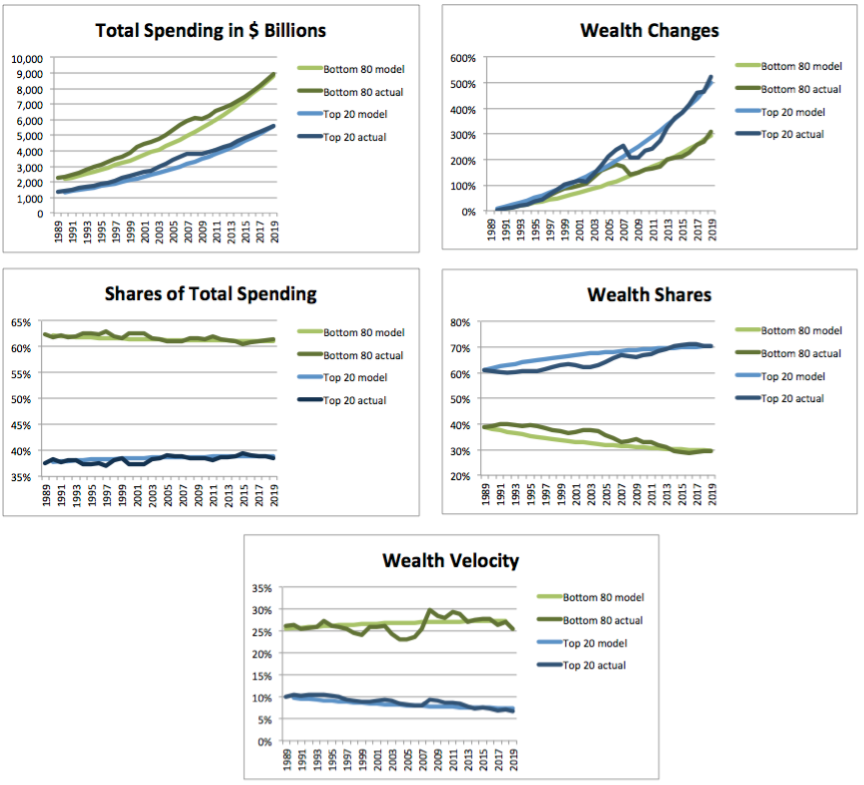
Compare the model’s predictions for 2019 to actual results; in each case they’re almost identical.
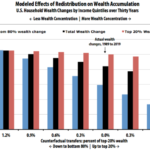
It’s easy to add counterfactuals to this model: what would have happened if some percentage of top-20% wealth was transferred, redistributed, to the bottom 80% every year over those three decades. The results are pretty eye-popping.

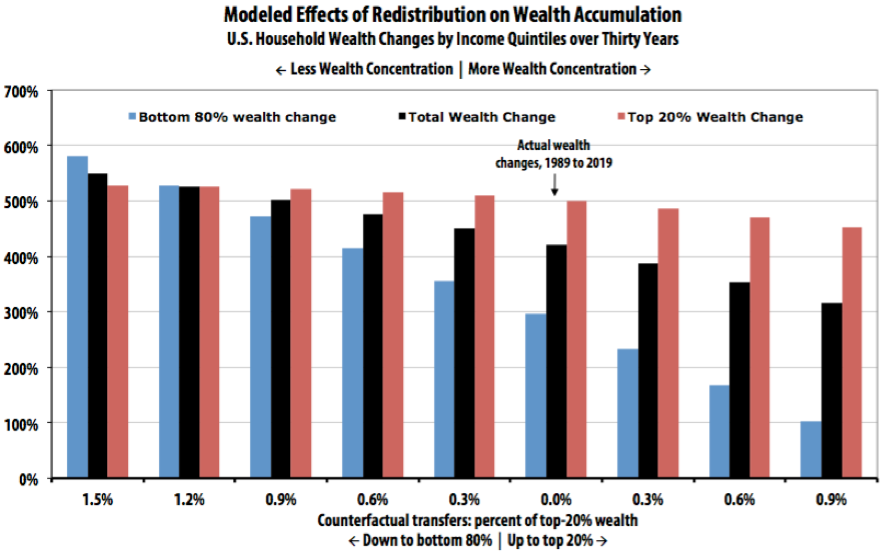
Downward redistribution results in more spending, more economic activity, and makes everyone quite a lot wealthier, faster – especially (no surprise) the bottom 80%. Taking the leftmost bars as an example: with an annual 1.5% downward transfer, greater spending would have resulted in a 549% total wealth increase, versus actual 421%.*
Most of that extra wealth growth would have gone to the bottom 80% (wealth growth of 527% vs actual 295%), while top-20% wealth growth would also have been slightly higher than actual (526% vs 499%). The top-20% share of wealth would have remained unchanged, versus the actual wealth-share increase that happened, from 61% to 71%.
With 1.5% in annual downward redistribution starting in 1989, 2019’s total wealth would have been 16% higher. Spending would be 52% higher.
It’s worth noting: excepting the two leftmost scenarios (1.5% and 1.2%), the top 20% keep getting relatively richer than the bottom 80%. Avoiding the increased wealth concentration that we’ve seen since 1989 (or even reducing the 1989 concentration) would have required at least an annual 1.2–1.5% downward wealth transfer from the top 20%.
Get Evonomics in your inbox
The very richest percentile groups, of course, might not have gotten richer with downward redistribution. It would depend on the mechanics and progressivity of the transfers. The data available here don’t let us determine that using this model. But the transfers would have to be far larger than envisioned here before top-percentile wealth levels (vs their relative share) actually stagnated or declined. Absent quite extreme redistribution, the rich keep getting richer as the economy grows. But with adequate redistribution to counter the ever-present trend toward economy-crippling wealth concentration, everybody else prospers as well.
The paper, model, data, and all calculations are available here.
* To put that 1.5% downward transfer in context: the total return on a passive wealthholder’s 60/40 stock/bond portfolio over that thirty years was about 7.5%. That’s all unearned income, received simply for holding wealth. With the transfer, wealthholders would only have received 6% annual unearned-income returns. The horror.
Donating = Changing Economics. And Changing the World.
Evonomics is free, it’s a labor of love, and it's an expense. We spend hundreds of hours and lots of dollars each month creating, curating, and promoting content that drives the next evolution of economics. If you're like us — if you think there’s a key leverage point here for making the world a better place — please consider donating. We’ll use your donation to deliver even more game-changing content, and to spread the word about that content to influential thinkers far and wide.
MONTHLY DONATION
$3 / month
$7 / month
$10 / month
$25 / month
You can also become a one-time patron with a single donation in any amount.
If you liked this article, you'll also like these other Evonomics articles...
BE INVOLVED
We welcome you to take part in the next evolution of economics. Sign up now to be kept in the loop!
