


By Steve Roth
In the next evolution of economics taking shape around us and among us, perhaps no school has been so transformational over recent decades as a loose, worldwide group best described as “accounting-based” economists. Modern Monetary Theory (MMT), with its central tenet of “stock-flow consistency” (or stock-flow coherence) is at the center and forefront of this group.
These accounting-based economists more than any others managed to accurately predict our recent Global Great Whatever. And Wynne Godley, rather the pater familias of MMT, predicted the current Euro crisis in amazingly precise and accurate detail — in 1992, before the project was even launched. These economists’ nerdy and businesslike, green-eyeshade and steel-tipped-pen approach gives them unique and accurate insights into the state of the economy, and its likely futures.
Get Evonomics in your inbox
Given these decades of focus on national accounts, it’s amazing that almost no economists are aware of a pretty remarkable fact:
Before 2006, the U. S. didn’t even have complete, stock-flow-consistent national accounts. That was the year that the BEA and the Fed released the Integrated Macroeconomic Accounts (IMAs; also presented as the “S” tables at the end of the Fed’s quarterly Z.1 report). They provided annual tables extending back to 1960, based on the latest international System of National Accounts (SNAs). Think: Generally Accepted Accounting Practices (GAAP), but for countries. We didn’t get quarterly tables in these accounts until 2012, only four years ago. And even today, we don’t have quarterly tables for subsectors of the financial sector.
In June 2013, the Z.1 report was renamed, from the Flow of Funds Accounts of the United States to the Financial Accounts of the United States, and the IMAs’ comprehensive data has been steadily more fully incorporated throughout the report — notably in the up-front Page i table, “Growth of Domestic Nonfinancial Debt,” which is now “Household Net Worth and Growth of Domestic Nonfinancial Debt.” See also Table B.1, “Net National Wealth,” which was added in the September 2015 release.
Before 2006, and even before 2012 or 2013, empirical economists didn’t have a full set of accounting books to work with.
And it’s not just the data. The national accounts’ earlier, incomplete accounting structures, and the terms defined based on those structures, made it impossible to even think coherently about some fundamental economic measures. Wealth, for instance. National wealth is, after all, a rather important economic measure. Adam Smith wrote a whole book about it. But until 2006 there was no coherent national accounting to depict it, or explain its accrual. So it’s been largely invisible and inexplicable to economists.
“Wealth” is just the beginning. As Noah Smith has said so aptly, economics terminology is a dumpster fire. The carnage extends right down to (necessarily accounting-based) definitions of income, saving, and investment. The national accounts and the terminology therein have both embodied and promulgated an incomplete (and deeply regressive) economic world view. Even accounting-based adepts often find themselves conceptually trapped inside these incomplete, inconsistent, jumbled, and muddled concepts and definitions.
Incomplete Accounts
Say what? “Not stock-flow-consistent?” The BEA’s National Income and Product Accounts (NIPAs) and the Fed’s Flow of Funds matrix (FFAs) — certainly seem to be internally consistent. Flows and stocks all add up and balance very nicely to zero. (That is, precisely, the problem. Read on.)
The NIPAs and the FFAs aren’t stock-flow-consistent in the sense that you expect of business financial statements — where all the flows in the income statement for a period fully explain the changes in the balance sheet from period-start to period-end (assets, liabilities, and their residual, net worth for households and shareholder’s equity/book value for firms). They’re not even close.
To be fair, the NIPAs have no pretensions or aspirations to full stock-flow consistency. Their purpose is to depict the within-period flows in the markets for newly-produced goods and services — with GDP/value-added at the tippy-top of an immense data pyramid. That’s all they do (admirably, if imperfectly). All those flows “balance.” But existing balance-sheet assets are almost completely outside their purview. They don’t even have balance sheets or tallies of total assets and net worth, nor do they tally asset swaps in the existing-asset markets (eg cash exchanged for stocks or bonds or land titles) — or lending and borrowing.
The FFAs — which are heavily based on NIPA data — have much greater ambitions, and achievements. They have consistent and mutually coherent flow and level tables for seven sectors; and they do tally flows and levels of financial assets, and lending and borrowing.
But take a look the Flow of Funds Matrix in the Z.1 report, on pages 1 (flows) and 2 (stocks). You’ll notice that three things are missing:
1. “Real,” or nonfinancial assets (notably, titles to real estate). The FFA matrix only tallies “financial” assets — those that have offsetting liabilities on other balance sheets. That is the sine qua non of “financial assets”: they represent claims on other balance sheets’ assets; it’s why the offsetting liabilities, claims, appear on those other balance sheets. Righthand-side liabilities are external claims on lefthand-side assets. (All liabilities are, by their very nature, “financial”; they represent claims from other balance sheets. Liability claims on Balance Sheet A are reflected as assets on lefthand side of Balance Sheets B, C, and D.)
2. Revaluation of existing assets. Capital gains and losses. The FFA matrix only tallies net issuance/retirement of financial instruments within a period. It doesn’t tally changes in market prices of instruments issued in previous periods.
3. Net worth. It’s just not there. Absent tallies of real assets, and revaluation, there’s no way this matrix can balance to changes in total assets or net worth, the bottom line of balance sheets. It can’t be stock-flow consistent.
By the standards of business financial statements, the sectoral accounting in the FFA matrix is radically incomplete.
Move to the detailed sectoral accounting tables underlying the FFA matrix — the levels (L) and flow (F) tables for each sector — and you’ll find the same thing. These sectoral “levels” tables are not balance sheets; they’re incomplete. The flow tables balance with the levels tables, but none of it balances to the righthand-side residual balancing item that makes balance sheets balance: net worth.
The Z.1 did add some balance sheets over time, but for only a few sectors (B tables), with necessary “reconciliation” (R) tables (flows, notably including asset revaluation/cap gains) to make them consistent with the F and L tables:
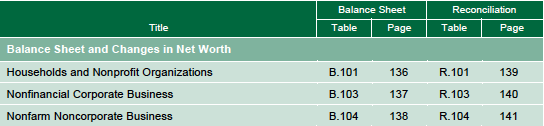
But these are rather bolt-on appendages, external and supplementary to the FFA matrix.
Given that accounting (and finance, and business) classes don’t even qualify as electives for undergraduate econ majors at Harvard and University of Chicago (to choose just two prominent schools), it’s unlikely that many economists can follow the tortuous paths from flows to balance sheets in all these tables — where those paths even exist. They’re completely untrained to do so. MMTers merit full props for putting this kind of accounting front and center in their pedagogy. But even their thinking frequently gets “stuck inside the FFAs.”
The Monetary Circuit
Why are things this way? The FFA matrix’s closed-loop, sum-to-zero accounting is a somewhat-expanded embodiment and expression of that old picture that everyone sees on Day One of Econ 101: the “circular flow” or “monetary circuit” diagram.
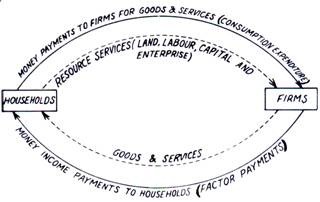
In this representation of economies (roughly what’s presented in the NIPAs), money just flows around in a circle — inevitably, one person’s spending is another person’s income. How could it be otherwise?
Of course (almost) all economists, and certainly accounting-based economists, know that this diagram is a simplified, stylized representation of only two economic sectors: households and nonfinancial businesses. They know that:
1. Governments create new private-sector assets (so-called “outside money”) out of thin air by deficit spending. (Since no new private-sector liabilities arise, this increases private-sector net worth.)
2. Banks, licensed and chartered as “money-printing” subsidiaries by government, also create new nonfinancial-sector assets (“inside money”) — and simultaneous, matching, sectoral liabilities — through lending. (Because these new assets and liabilities net out, the action of bank lending in and of itself does not, in accounting terms, increase private-sector net worth — even though it does create new assets.)
Everyone agrees that government deficit spending and bank lending create “money” (much better: “assets”) in ways that are impossible in the simplified spending-equals-expenditures circuit diagram.
Nevertheless, a huge amount of economic thinking quietly operates inside that simple circular model. It’s the model most economists unconsciously run in “native mode” in their heads when they engage in their ubiquitous thought experiments. It’s the core heuristic that’s trained into their System 1 thinking, invoked instantly and invisibly when they bring System 2 into play.
The FFA matrix does account for the “inside” (banks) and “outside” (government) creation of new private-sector balance-sheet assets — the net issuance/retirement of financial instruments (dollar bills, checking-account deposits, bonds, equity shares, Fed reserves…). This includes corporate IPOs and company dissolutions. Its closed loop is more comprehensive than the NIPAs’. And many economists do think inside that larger circuit model. But that model, likewise, is not fully comprehensive. It ignores real assets, and changes in existing-asset prices/values — both real and financial.
Because: Including revaluation/cap gains would explode the closed-loop, balance-to-zero matrix. They would break the “monetary circuit.”
Because: The existing-asset markets “print money” — at least in the sense of your new financial advisor asking you, “How much money do you have?” This is the third, and overwhelmingly the largest, way that aggregate asset balances are added to the private-sector balance sheet. Runups in the stock or real-estate markets increase private-sector assets — and net worth, because those runups have no effect on private-sector liabilities.
The Conservation of Money Fallacy
The new assets created by market runups don’t “come” from anywhere. The don’t “flow into” the aggregate asset pool (so can’t exist in the “flow of funds”).
When a block trade of Apple stock goes through at a higher price, brokerages worldwide see that change and instantly mark Apple shares to market on everybody’s statements (hence balance sheets) — creating new balance-sheet assets completely ab nihilo. No sector “issues” those new assets the way banks and governments do.*
Absent accounting for that asset revaluation, the “inside money” and “outside money” mechanisms are completely inadequate to explain changes in bottom-line balance-sheet measures. The FFA matrix — even with its inclusion of inside and outside money creation — is subject to a “conservation of money” fallacy, as embodied in that hoary old monetary circuit diagram. The FFA matrix captures some of the money (read: asset) creation in the total economy, but by no means all of it.
To put it another way: the economy doesn’t balance to zero. It balances to net worth.
How incomplete are the FFAs? Here’s a picture of the three “asset creators,” purely to visualize relative magnitude — these measures are in no way “summable” as they’re not sector-equivalent:
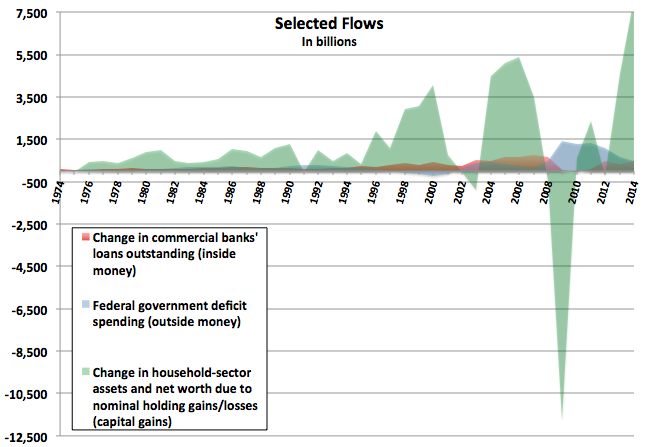
Capital gains dominate changes in private-sector balance sheets, always and everywhere.
(Note that firms’ market value all ends up as assets on household balance sheets, is ultimately “owned” by households** at zero or more removes. That’s what the possessive apostrophe in “shareholders’ equity” means. The household sector “owns” the firms sector. So household assets include the asset-market value of all firms, their market capitalization. This is why the Z.1 now reports household net worth right up top.)
If your empirical work is operating “inside the FFA matrix,” that revaluation of real and financial assets is completely invisible to you, and to your economic modeling. Ditto total assets and net worth.
Yet the balance-to-zero conservation of money fallacy prevails ubiquitously, even frequently among leading accounting-based economists: “the economy’s financial flows are a closed system, so one sector’s deficit is another’s surplus, and vice versa.” (It’s perhaps significant that MMT has often been referred to as the “circuitist” school. It sometimes feels like watching enlightened Copernicans trying to justify the sun-centered model using old Ptolemaic epicycles.)
An important aside: the ultimate source and cause of wealth creation is surplus from production — combining natural resources with human effort plus skills, abilities, knowledge, and know-how, so that more-valuable stuff (tangible and intangible, valuable to humans) comes out than goes in. This is the within-period “value added” that the NIPAs try to tally up. But government deficit spending, bank lending, and asset revaluation are the three proximate mechanisms whereby that “real” aggregate accumulation of new stuff is reflected on balance sheets as new unit-of-account denominated assets — designated monetary claims on all that new real stuff (a.k.a. “wealth”).
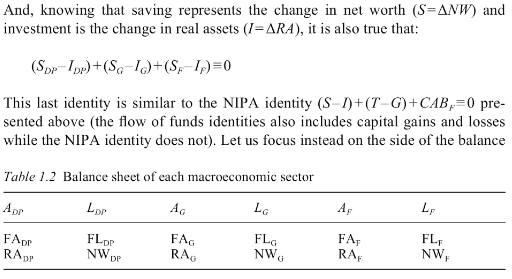
The IMAs’ Complete Accounting Construct
Returning to the IMAs: they are (can be) stock-flow consistent because each sector has 1. a complete balance sheet tallying both financial and nonfinancial assets, and 2. a “revaluation” (flow) account (plus an Other Changes in Volume account tallying disaster losses, measurement changes, etc.). Here’s what the Revaluation account looks like, for the household sector for 2005 and 2006:
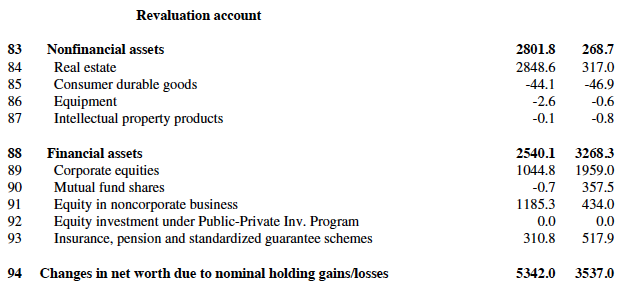 This is, necessarily, mark-to-market or “Haig-Simons” accounting (see Godley and Lavoie pp. 137–41 and 290–94). If you don’t mark up existing-asset values based on market prices, there’s no way you can tally a sector’s total assets and net worth. Our national accountants use various market indexes, with corrections based on survey data, to achieve this marking to market and keep it consistent from period to period.
Mark-to-market accounting is perfectly familiar from business accounting. Check out (Other) Comprehensive Income in any public firm’s financial statements. If Apple or GE owns a portfolio of stocks and the stock market goes up, they post those increases to their financial statements. Otherwise they couldn’t tally their total assets at the end of the period. (Please: the policy of taxing capital gains when “realized” is a completely separate issue.) It’s also what households of any means do, though much less frequently: when first visiting a retirement advisor, they tally up their assets at market value, their liabilities, and their net worth.
When millions of people look at their brokerage statements every day, they’re looking at marked-to-market values.
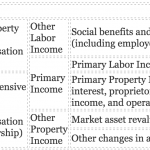
The IMA’s accounting lets you assemble a complete and coherent, condensed accounting statement like firms provide, fully explaining balance-sheet changes, but for economic sectors:
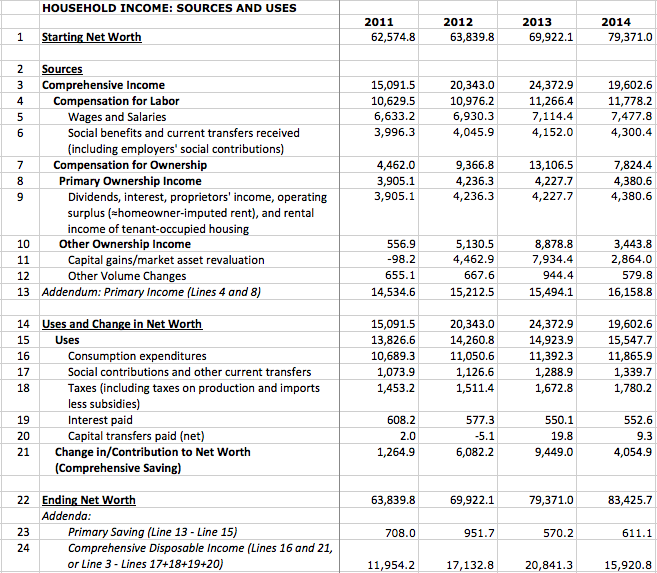
The “comprehensive” measures here (discussion and graphs) are all based on Haig-Simons income, which includes accrued capital gains. The “primary” usages are derived from IMA terminology: “Balance of Primary Incomes.” The “ownership income” usage — instead of “property income” — is arguably only a rhetorical change. But it’s an important piece of rhetoric, revealing what recipients are actually being compensated for: simply…having wealth; owning stuff.
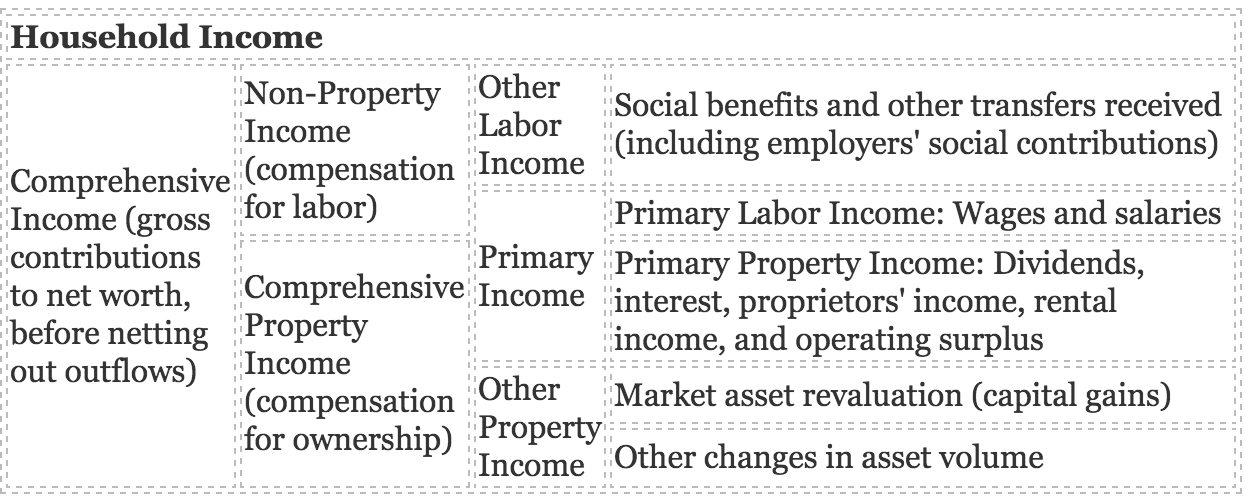
Here’s a matrix to help understand how the income measures relate to each other:
Perhaps the most significant usage here is Comprehensive “Saving” — saving being the most vexed and ubiquitously misunderstood of economic terms. Haig-Simons saving simply equals…change in net worth.
The FFA’s definitions of “saving” have no accounting relationship to total assets or net worth. The relationship is, perforce, completely undefined. While “saving” and “net investment” do sum cumulatively to something we might call “book value” (see: perpetual inventory method), that measure’s relationship to market value and total assets is unaccounted for in the FFA matrix. Note that comprehensive saving here is often an order of magnitude larger than primary saving.
The terms used here — like the terms used in the NIPAs, FFAs, and IMAs — are not just incidental to the accounting presentation. They impart, in small, the economic model, assumptions, and defining accounting identities that are implicit but often dangerously invisible in this or any other accounting presentation. They make clear that this is a rhetorical presentation, rather than hiding that rhetoric behind a facade of it’s-just-accounting truthiness.
For one robust example of similar thinking on this re-jiggering of the national accounts and their presentation, see Robert Eisner’s 1989 The Total Incomes System of Accounts.
What a Complete Accounting Construct Means for Economics
The implications of this complete accounting are not just mechanical. They’re transformative to how we (can) think about economics, and economies. Prior to the publication of the IMAs, economists were quite literally not playing with a full deck. (Excepting some pioneering economists over the decades — notably Edward Wolff and of course Thomas Piketty and company, who have painstakingly assembled such accounts themselves, using disparate sources and methods. But there’s no way they could deliver the massive pyramid of necessary accounting understructure; that requires thousands of government accountants and economists.) The huge majority of economists are still working, and trying to think, within incomplete accounting structures.
Here are just a few of the Big Economic Questions whose answers appear very differently within a complete accounting structure:
Sectoral balances. The “sectoral-balances” equation and its accompanying graph are arguably the poster exhibits for much MMT thinking. Wynne Godley and Marc Lavoie explicate them (though not by that name) in Appendix 12.1 to Monetary Economics. The graph looks like this, in a three-sector presentation:
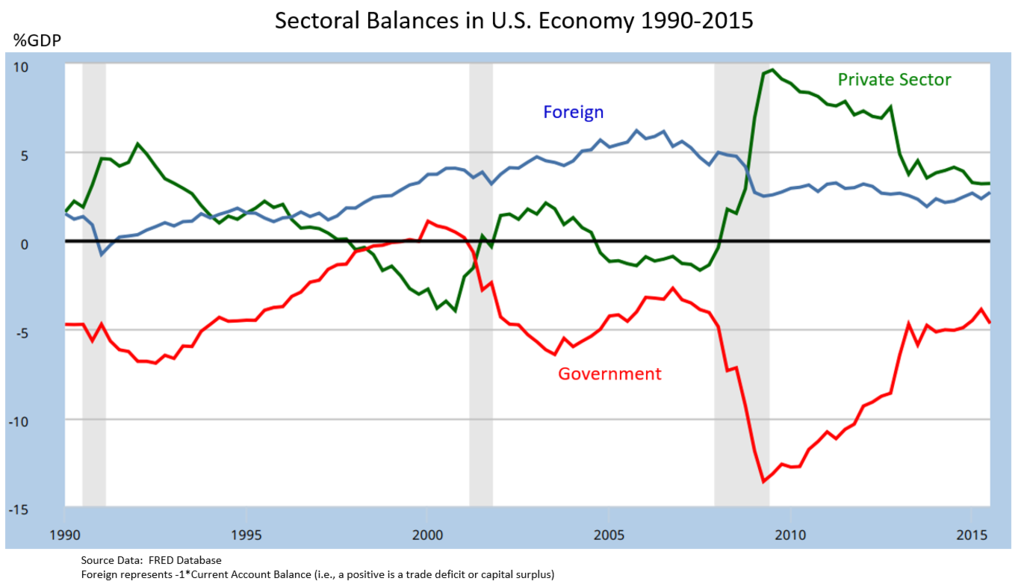
The common takeaway: government deficit spending (plus/minus trade imbalances) equals private-sector “surplus.” Government deficit spending is the “source” of that private-sector surplus or “financial saving.”
But: this identity and graph are purely constructs of the FFA matrix, with all the incompleteness detailed above. They correctly suggest that deficits deliver net worth onto private-sector balance sheets (in a way that bank lending, with its simultaneously-issued private-sector liabilities, does not). But they very much do not explain changes in net worth. As we saw above, capital gains overwhelmingly dominate those changes. Deficits deliver a surplus onto private-sector balance sheets. They do not deliver the surplus — depending on how “surplus” is defined.
It’s worth noting that “surplus” is not a term used in the national accounts. So its commonly-bruited MMT meaning is essentially tautological: “that portion of the change in private-sector assets and net worth that results from government deficit spending.”
Because the sectoral balances are based on the incomplete FFAs, a core measure in the sectoral balances discussion — net acquisition of financial assets (NAFA) — does not equal change in net financial assets. NAFA ≠ ∆NFA. Or ∆FA. Or ∆A. Or ∆NW. The sectoral balances graph only depicts net new issuance/retirement of financial assets, not the change in value of existing assets, real and financial.
Get Evonomics in your inbox
It’s also worth noting that the NFA measure is a rather arbitrary posting of all liabilities against financial assets only — not against total assets. This even though a large portion of those liabilities consists of mortgage debt, which is rather explicitly related to real assets.
Godley and Lavoie are very much aware of this conundrum. They state it explicitly in their appendix:
NAFA is different from the increase in the wealth of households, ∆V, since it does not incorporate capital gains.
But they leave that statement hanging, don’t discuss its implications in that appendix. Tymoigne and Wray also mention it, but only in a parenthetical that may leave students confused:
Confused because: FFA “saving” measures do not equal change in net worth — even if you include the bolt-on B and R tables (external to the FFA matrix) as being part the flow of funds. Revaluation is not included in FFA “saving” measures. A saving measure that does equal change in net worth is eminently sensible, even obvious (see Comprehensive Saving, above). But saving as defined in the FFAs is not that measure.
None of this is to demean the importance of sectoral-balances thinking. It has profound implications — economic, rhetorical, and political. (See especially Steve Randy Waldman, including the 408 meaty comments there if you dare.) It’s simply to impart a clear understanding of that identity in the context of a complete accounting construct.
The Paradox of Monetary Profits. Closed-loop monetary-circuit thinking makes monetary profits impossible. Amazingly, most economists don’t even know about this enigma, despite two centuries’ of anguished discussion by many of the leading practitioners in the field: Marx, Kalecki, Keynes, Schumpeter, Samuelson, and others, plus some very insightful recent accounting-based economists. You’ll find an able rundown of that thinking and history, plus important contributions, in Dirk Bezemer’s great paper here. (See also.) Professors don’t even mention this little problem to impressionable young Econ 101 students.
Monetary profits simply can’t exist if one person’s spending equals another person’s income. “Inside/outside money” thinking does little or nothing to solve this.
Without going into the details, we can say that the problem is deeply related to questions of capital gains as “income,” perhaps best represented today in “the Amazon conundrum”:
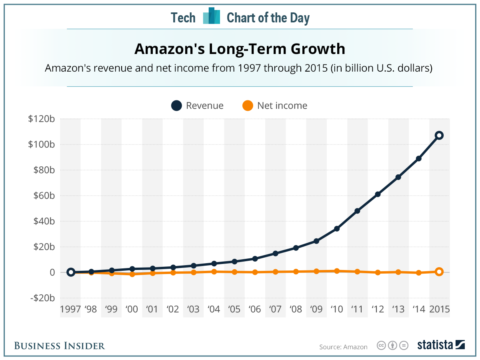
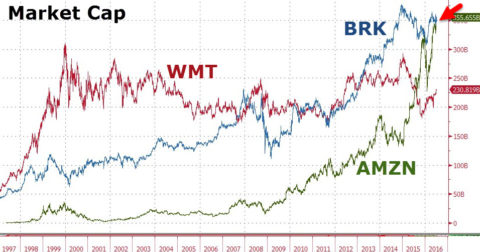
Even with more than half a trillion dollars in revenues, Amazon has “earned” almost zero “profits” in its history. But over that period it has delivered more three hundred billion dollars onto the asset side of household-sector balance sheets. Absent an aggregate accounting that includes capital gains, and economic theory incorporating those measures, the economics of this conundrum are conceptually inexplicable.
Just one clue to such theory: if the accounting period is short enough, all “profits” are capital gains — stuff bought/created in one period is sold at a higher price in the next. (Hell: buying lunch is an “investment” in the afternoon’s work.) If the accounting period is long enough, all capital gains are profits from within-period production. (This raises grave issues with the whole “factors of production” construct, and its assumption that each factor is compensated relative to its inputs.)
Saving and Investment. There is no measure labeled “Investment” in the IMAs. So one side of the much-ballyhooed Saving = Investment accounting identity…simply doesn’t exist. The IMA’s “Capital Formation” is very similar, but the change in terminology is significant.
To quote Simon Kuznets, the man who led the creation of the NIPAs in the 1930s, “capital formation…represents the real savings of the nation.” (Capital in the American Economy, page 391.) Ultimately, our national “savings” (the stock) consists of our accumulated stuff. But the money-designated value of that stuff — our wealth — is another matter entirely. As detailed in the next section, the new-goods and existing-assets markets yield wildly different estimates of that value.
So while you could mimic S = I by saying that Saving = Capital Formation, doing so basically just reveals that identity for the rather facile truism that it is: our accumulated savings consists of the cumulative sum of our capital formation (net of capital consumption). Facile because: that measure (basically “book value”) is wildly different from our tally of monetary wealth.
There are clearly defined accounting-identity relationships between saving measures and capital formation/investment (and lending/borrowing). But they’re kind of complex. Spend some quality time in the FFAs; you’ll never find a saving measure that equals an investment measure. Saying that Saving equals either Investment or Capital Formation does very little to clarify those relationships. Quite the contrary. (This especially as the IMAs include two “net lending/borrowingca” measures for each sector — one for the Financial Account, one for the Capital Account.)
The Wealth of Nations. How much is all our stuff — I hesitate to say our “capital” — worth? This necessarily must include our skills, knowledge, and abilities, in addition to more tangible things — all the stuff we can consume, sure, but also everything that gives us capacity to produce hence consume in the future.
Until 2006, our national accounts only tallied up “book value” — the cumulative sum of “net investment” (net of capital “consumption” through use, decay, obsolescence, etc.). And that mostly of tangible stuff — very 19th century. But vast swaths of our “investment” are untallied: knowledge, skills, and other human capital to start with. Any firm would certainly consider its educated, trained, capable workforce to be a prime “asset,” even if its value wasn’t, couldn’t be, tallied numerically. This is certainly true for nations as well. No economist would deny the massive real value of an almost-universally literate populace. Book value doesn’t and can’t tally most of that stuff. (Though recent revisions to the national accounts have incorporated much intellectual property — even “brand value” — into measures of capital.)
Which leads us to a different measure of our stuff’s value: total assets or net worth (for the household sector, which includes the market value of equity shares in the firms sector, the household sector’s wholly-“owned” subsidiary). These totals are the asset markets’ best estimate of what all our stuff, and our future production capacity, is worth. This necessarily includes all that impossible-to-measure stuff. The total market value of assets in a country with a healthy, educated, skilled workforce will necessarily be higher than in one without those things. The value of our “good government” has to be in there somehow as well; really bad government would (does?) make our total assets less valuable.
This is to suggest that Hayek was basically right: only the markets can calculate any reasonably valid estimate of all our stuff’s total value. But this market estimate still requires several pounds of salt. Median household net worth in prosperous Germany, for instance, is among the lowest in Europe, because households don’t need to individually accumulate assets to lead secure, thriving lives. Much of their future consumption spending will be done for them by the state. That future spending is not capitalized onto the asset side of household balance sheets. So: apparently low household assets, and net worth.
Nevertheless, tallied assets and net worth are arguably at least good indexes of countries’ changing prosperity — the wealth of nations.
We now have two estimates of that total: the NIPAs’ perpetual-inventory/cumulative-sum-of-investment/book-value estimate, and the IMAs mark-to-market estimate. Both are based on market prices (Hayek would be pleased). The first is based on what people paid for stuff in the market for newly-produced goods and services. But then in ensuing periods the existing-asset markets second-guess that estimate, and decide that all the previously produced stuff is worth much more than it was sold for.
The implications of this? The existing-asset markets are constantly telling us that GDP is (was) wildly underestimated. We actually produced more value than we thought in earlier periods, but we paid less than it turned out to be worth. (Human risk aversion as revealed in Prospect Theory could explain this nicely.) The difference is perhaps 15–25% of GDP — the portion of household income derived from capital gains, unaccounted for in the NIPAs (and the FFAs) because those gains by definition happen “outside the period,” the NIPAs’ field of view.
Money and Velocity. Monetarists’ “money times velocity” construct has been a core concept in economists’ mental and formal models, across the spectrum, for decades. There’s a pool of money, and it turns over X times a year in spending. That’s GDP, or Y. M*V=Y. It’s a seductively intuitive idea.
But dig a little, and you find that “money” is a decidedly shifty concept therein (as it is throughout economics). Practitioners refer to various monetary “aggregates” to denote the “stock of money” — MB or monetary base, M0, M1, MZM, “divisia” measures, etc., plus the incoherent and undefined “money supply” — all seeking to define the stock of money as a particular circumscribed set of financial instruments that are “currency-like,” whose prices are somehow pegged to the unit of account (e.g. “the dollar”). You’ll frequently see economists silently shift between these measures within a discussion, sometimes even within a sentence. It’s a dumpster fire.
With the tallies of assets and net worth in the IMAs, it’s possible to replace that problematic “pool” of “money” (M) with a more solid measure: wealth. The “velocity of wealth” at least provides some alluring long-term correlations with other economic measures. Here for instance, the velocity of wealth, interest rates, and inflation over the last half century:
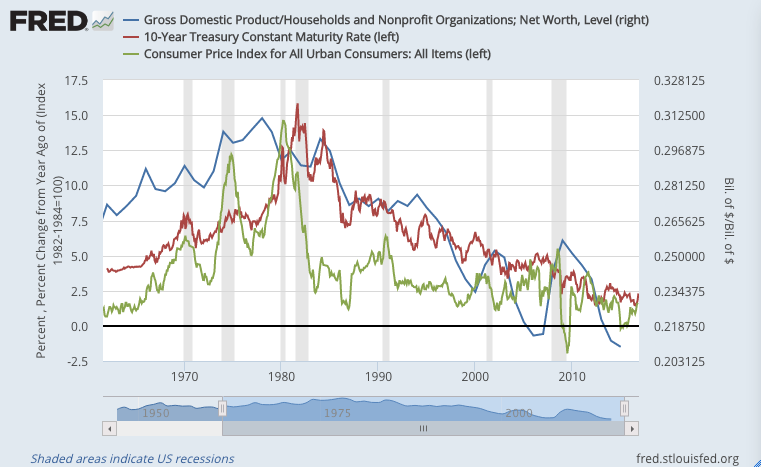
Likewise, if the “quantity of money” measure (the “money stock”) is an important causal driver or predictor, wealth is a promising measure of that quantity. Since the late sixties, for instance, every time you saw a year-over-year decline in real household wealth (assets or net worth), you were in or about to be in a recession. (Roger Farmer’s research program may be especially pertinent to this.)
Economists: Define Your Terms
The biggest takeaway from all this is economists’ need to precisely define their terms, in accounting terms — something they’ve been abysmal at. Dumpster fire? It’s more like the sub-basement of Fukushima Three.
Accounting is economic modeling. And economic modeling is inevitably rhetorical, hence political. To quote Michael Hudson and Dirk Bezemer:
“Capital” gains do not even appear in the NIPAs, nor is any meaningful measure provided by the Federal Reserve’s flow-of-funds statistics. Economists thus are operating “blindly.” This is no accident, given the interest of FIRE sector lobbyists in making such gains and unearned income invisible, and hence not discussed as a major political issue.
If you don’t deeply understand the model you’re thinking within, and its defined terms, you can’t use it to understand the (inevitably political) economy.
How often have you heard “it’s an accounting identity!” as if that meant “it’s inevitably true”? That doesn’t follow. Accounting identities are nothing more than definitions of terms — actually complexes of interrelated definitions. And the terms very much matter. (See the “comprehensive” and “primary” income and saving usages above, for instance.) Absent a deep, coherent understanding of those accounting identities, metabolized into System 1 heuristics, you simply don’t know what the terms mean. When you say “it’s an accounting identity,” you’re simply saying “it’s true by definition.” Or more saliently: “it’s true by this definition.” The logic of these arguments can get very circular, very quickly.
If I were designing an Econ 101 curriculum based on my fifteen years trying to untangle and understand this whole conceptual mess, I’d start with a week or two of top-level empiricism: learning to deeply understand the national accounts — what they say, and especially what they mean. They’re the necessary, big-picture vehicle for understanding a whole raft of economic concepts and terms — income, saving, wealth, assets, debt, financial instruments, prices, money, utility, and perhaps most importantly, value. *** Or at least they’re an excellent avenue into all those ultimately philosophical subjects.
In keeping with the liberal-arts approach to critical thinking that arguably makes American-style universities the best in the world, start with the philosophy of accounting — instead of actively excluding it from the curriculum as econ programs do today.
To quote David Glasner, “as much as macroeconomics may require microfoundations, microeconomics requires macrofoundations.” (Hat tip and excellent further reading: Steve Randy Waldman.) Those foundations are the technical economic terms used — because words are what we use to think together — and the mutually coherent and interrelated accounting identities that define those terms.
Absent those definitions, economists quite literally don’t know what they’re talking about.

* A note for MMT devotees: In Monetary Economics, Godley and Lavoie provide two matrixes that incorporate capital gains — Tables 2.7 and 11.2. They are the only matrixes in the book that do not sum to zero across the bottom. That is exactly as it should be; they shouldn’t and can’t, for the reasons detailed here. The economy doesn’t balance to zero; it balances to net worth. G&L also include capital gains in Table 5.2, but as “only as a memo…capital gains have not been included within the definition of disposable income, but this of course is a matter of convention.” (Emphasis mine.) Capital gains are not part of the Model LP being discussed in that section.
** A very important qualification here, with full props and thanks to J. W. Mason: households don’t “own” firms in the sense that you own your car, can control it and do what you want with it. The “ownership” described here is purely an accounting statement: all firms’ market-cap value is reflected and revealed, via equity-share ownership, on the asset side of the household-sector balance sheet. A further aside, rather eye-popping to me when I discovered it: hedge funds and private-equity firms are all accounted for, pretty much invisibly, inside the household sector. (See also Note 1 to Table F.101.) They’re treated basically like households. This is because like households but unlike other firms, they (or at least their participants) “own” their own righthand-side balancing item — net worth/equity value.
*** Crucially, there would be perhaps a day or two on inflation measures, hedonics, and purchasing-power parities.
2016 December 3
Donating = Changing Economics. And Changing the World.
Evonomics is free, it’s a labor of love, and it's an expense. We spend hundreds of hours and lots of dollars each month creating, curating, and promoting content that drives the next evolution of economics. If you're like us — if you think there’s a key leverage point here for making the world a better place — please consider donating. We’ll use your donation to deliver even more game-changing content, and to spread the word about that content to influential thinkers far and wide.
MONTHLY DONATION
$3 / month
$7 / month
$10 / month
$25 / month
You can also become a one-time patron with a single donation in any amount.
If you liked this article, you'll also like these other Evonomics articles...
BE INVOLVED
We welcome you to take part in the next evolution of economics. Sign up now to be kept in the loop!
