


By Steve Roth
September 18, 2017. Updated December 13, 2024.
Remember Smaug the dragon, in The Hobbit? He hoarded up a vast pile of wealth, and then he just hung out in his cave, sitting on it (with occasional forays to further pillage and immolate the local populace).
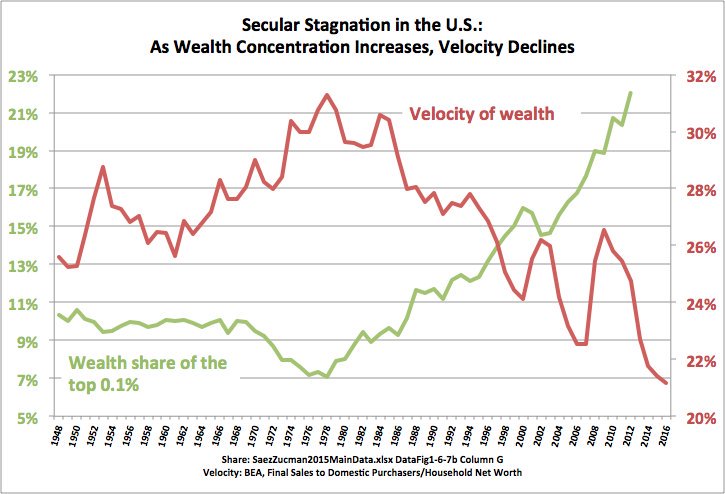
That’s what you should think of when you consider the mind-boggling hoards of wealth that the rich and very rich have concentrated into ever-fewer hands in America over the last forty years. The graph here only shows the very tippy-top of the scale.

That bright pink line at the very bottom that you can barely see? That’s the top 10%. Everyone below that is simply…invisible. Even in this Very Tall Graph.
A half-century ago, in 1975, the richest 1/100th of 1% of U.S. adults (about 17,000 people back then) had $27 million each, average (in 2018 dollars). In 2019 they had $350 million each — a thirteenfold increase. You can be sure it’s gotten even more extreme since then.
These people could spend $17 million every year and they’d still just keep getting richer, forever, even if they did absolutely nothing except choose some index funds, watch their balances grow, and shop for a new yacht for their eight-year-old.
If you’re thinking that they “deserve” all that wealth and all that income just for owning stuff, because they’re “makers,” think again: between 50% and 70% of U.S. household wealth is “earned” the old-fashioned way (cue John Houseman voice): it’s inherited.
That concentrated, dynastic, static wealth is strangling our economy, our economic growth, our national prosperity. Wealth concentration drives a vicious, downward cycle, throttling the very engine of widespread wealth creation itself.
Because: people with lots of money don’t spend it. They just sit on it like Smaug in his cave. The more money you have, the less of it you turn over in spending every year. If you have $10,000, you might spend it this year. If you have $10 million, you’re not gonna. If you have $1,000, you’re likely to spend it all this month.
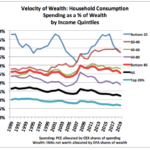
Here’s a somewhat dated picture of what that looks like:
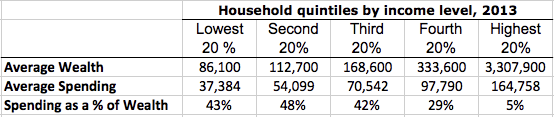
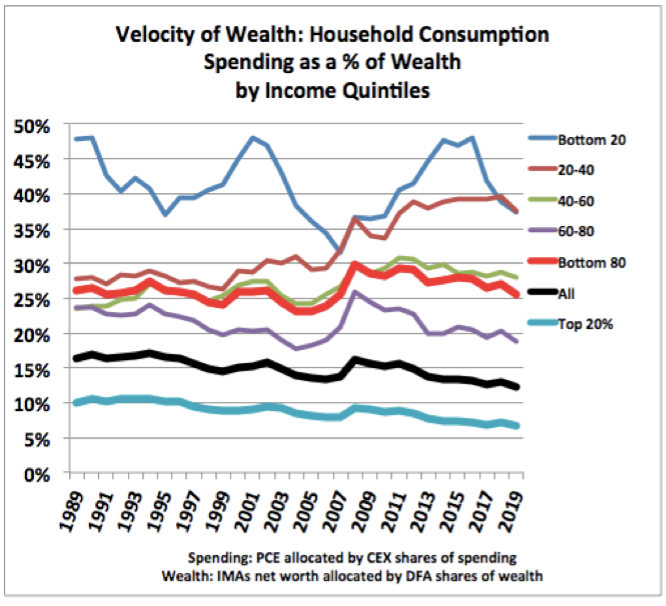
These broad quintile averages obviously don’t put across the realities of the very poor and the very rich; each quintile spans 25 million households. But the picture is clear. The bottom two quintiles turn over roughly 40% of their wealth every year. The bottom 80% turn over about 25% of their wealth. The richest quintile turns over 5%. We can only imagine how little of their wealth the truly rich turn over in spending. For a given amount of wealth, broader wealth dispersion means more spending. It’s arithmetic.
Now go back to those top-.01% households. They have about $8.8 trillion between them. Imagine that they had half that much instead (the suffering), and the rest was spread out among all American households — about $35,000 for each household.
Assume that all those lower-quintile households spend about 40% of their wealth every year, as they have over decades. They each get to spend an extra $14,000, and enjoy the results. Sounds nice, and remember: spending is economic activity. It’s what’s causes production. That spending and economic activity simply won’t happen with concentrated wealth. The money will just sit there.
Get Evonomics in your inbox
Now obviously just transferring $4.4 trillion dollars, one time, is not going to achieve any imagined nirvana. (Annual transfers down from rich to poor are another story; you can see a model of that here.) Nor is it bloody well likely to happen. That example is just to illustrate the arithmetic. Absent some serious changes in our wildly skewed income distribution (plus capital gains, the overwhelmingly dominant mechanism of wealth accumulation, which don’t count as “income”), that wealth would just get sucked back up to the very rich, like it has increasingly for the past forty years — and really, the past several thousand years.
If wealth is consistently more widely dispersed — like it was after WW II — the extra spending that results causes more production. (Why, exactly, do you think producers produce things?) And production produces a surplus — value in, more value out. It’s the ultimate engine of wealth creation. In this little example, we’re talking a trillion dollars a year in additional spending and production. GDP would be 5.5% higher.
If you think concentrated wealth causes better investment and greater wealth accumulation, ask yourself: what economic theory says that $185 trillion in concentrated wealth will result in more or better investment than $185 trillion in broadly dispersed wealth? Our financial system is supposed to intermediate all that, right? All that IRA and 401K money held by tens of millions of households is invested in productive enterprises.
Or ask yourself: would Apple be as successful as it is if its business model was based on selling eight-million-dollar diamond-encrusted iPhones? Broad prosperity is what made Apple, Apple. Concentrated wealth “distorts” producers’ incentives, so they produce, for instance, a million-dollar Maserati instead of forty (40) $25,000 Toyotas — because that’s what the people with the money are buying. Which delivers more “value,” prosperity, and well-being?
This little envelope calc is describing a far more prosperous, comfortable, and secure society — far richer and one hopes far more peaceful than the one we’re facing under wildly concentrated wealth. With the possible exception of a few very rich multi-generational dynasties, everyone’s grandchildren will be far better off 50 years from now if wealth is more widely dispersed. And over that half century, hundreds of millions, even billions of people will live far richer, better lives.
Why wouldn’t we want that? Why wouldn’t we do that? We know the answer: rich people hate the idea — even those who aren’t all that rich but foolishly buy into the whole trickle-down fantasy. And the rich people…have the power.
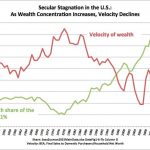
By contrast to that promising possibility, here’s what things look like over the last seven decades:
Here are the results — growth in (“real” inflation-adjusted) GDP per capita:

Excepting the 2021 covid bounceback, the last time economic growth broke 5% was in 1984.
So how do we stop the insane increase in wealth concentration (or even…reverse it, perish the thought), given that we’ve mostly failed to do so for millennia? Start with a tax system that actually is progressive, like we had, briefly, during the postwar heyday of unprecedented, rampant, and widespread American growth and prosperity. And greatly expand the social platform and springboard that gives tens of millions more Americans a solid place to stand, where they can move the world.
All of this dweebish arithmetic, of course, doesn’t put across the real crux of the thing: power. Money, wealth, is power. So it is, so it has been, and so it shall be in our lifetimes and our children’s lifetimes (world without end, amen). Money is the power to walk away from a shitty job. To hire fancy lawyers and lobbyists, maybe even buy yourself a politician or two. If we want minorities and the non-“owners” to have power, they need to have money.
Add to that dignity, and respect, which are deserved by every child born. Sadly but truly, they are also delivered to those who have money. You can bemoan that reality, but in the meantime, let’s concentrate on the money.
If you want to create a workers’ utopia, a better world for all, seize the wealth and income.
Data Sources
The data for the tall chart is from Gabriel Zucman, PSZ2020AppendixTablesII(Distrib).xlsx Table TE3. Excel spreadsheet with data and chart here: https://www.icloud.com/iclouddrive/03d4-hOlsutbaa6EdIKdK5_9g#Tall_graph_Concentrated_Wealth.
Average wealth by quintile is from the Federal Reserve’s Survey of Consumer Finance (SCF), scf2013_tables_internal_nominal.xls, Table 4. (Top 20% wealth in the table above is an average of the means for 80-90% and 90-100%.)
Spending by quintile is from the BLS Consumer Expenditure Survey (CEX; earlier years here), Table 1101 (adjusted; see below): https://www.bls.gov/cex/2013/combined/quintile.xlsx. All annual expenditure-by-quintile tables 1984-2016 in one spreadsheet here.
Note: Measuring expenditures is very difficult, especially the spending of the very rich. They’re not keen to answer lengthy surveys like the CEX, given that they don’t even want their housekeepers to know that they paid $12 for a loaf of bread. As a result, CEX — which breaks out spending by quintile — misses about 40% (xlsx) of the spending tallied in the BEA’s Personal Consumption Expenditures (PCE) — which doesn’t. As a rough corrective for that discrepancy, the spending-by-quintile figures in the table above are CEX measures multiplied by 1.66. This “PCE correction” results in far more plausible spending figures, especially for the top 20%: Average $165,000 in 2103 annual spending versus CEX’s $100,000.
Donating = Changing Economics. And Changing the World.
Evonomics is free, it’s a labor of love, and it's an expense. We spend hundreds of hours and lots of dollars each month creating, curating, and promoting content that drives the next evolution of economics. If you're like us — if you think there’s a key leverage point here for making the world a better place — please consider donating. We’ll use your donation to deliver even more game-changing content, and to spread the word about that content to influential thinkers far and wide.
MONTHLY DONATION
$3 / month
$7 / month
$10 / month
$25 / month
You can also become a one-time patron with a single donation in any amount.
If you liked this article, you'll also like these other Evonomics articles...
BE INVOLVED
We welcome you to take part in the next evolution of economics. Sign up now to be kept in the loop!
