


The determinants of economic growth have long ranked as one of the most important questions in the history of economic science, along with such puzzles as price formation and income distribution. Over the past generation, the rate of economic growth in advanced Western democracies has slowed markedly, which raises the old (but now fashionable) spectre of secular stagnation. Secular stagnation is a particularly acute macroeconomic problem insofar as it has a direct connection to improvements in the national standard of living, whether tabulated using objective benchmarks like life expectancy or subjective metrics like happiness.
Larry Summers appears to be the man responsible for resurrecting the term, but there are echoes of the concept stretching back more than a century. In its contemporary formulation, secular stagnation manifests itself in the anemic GDP growth witnessed over the business cycle resulting from depressed levels of business investment, particularly in machinery and equipment. There have been variegated explanations for secular stagnation, but Summers flags a few crucial variables, including an expansion of the technology frontier, slower productivity growth and an aging population. As Summers sees it, these factors have contributed to an imbalance between savings and investment. The proclivity to save has outpaced the desire to invest, which pushes interest rates down, depresses demand and decelerates growth.
Get Evonomics in your inbox
And while this narrative may have some truth in it, there is an important process that is omitted, namely the explosion of mergers and acquisitions after 1990. The past quarter century has witnessed a historically unprecedented shift in business investment towards consolidation, and this shift—which has not received the attention from researchers that it deserves—has altered the structure and functionality of American capitalism. Before exploring U.S. merger activity, it is important to document the deep history of U.S. economic performance so that the phenomenon under investigation is clearly discernable.
Documenting the Slowdown in Investment, Job Creation and GDP Growth
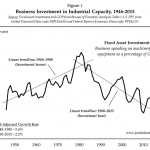
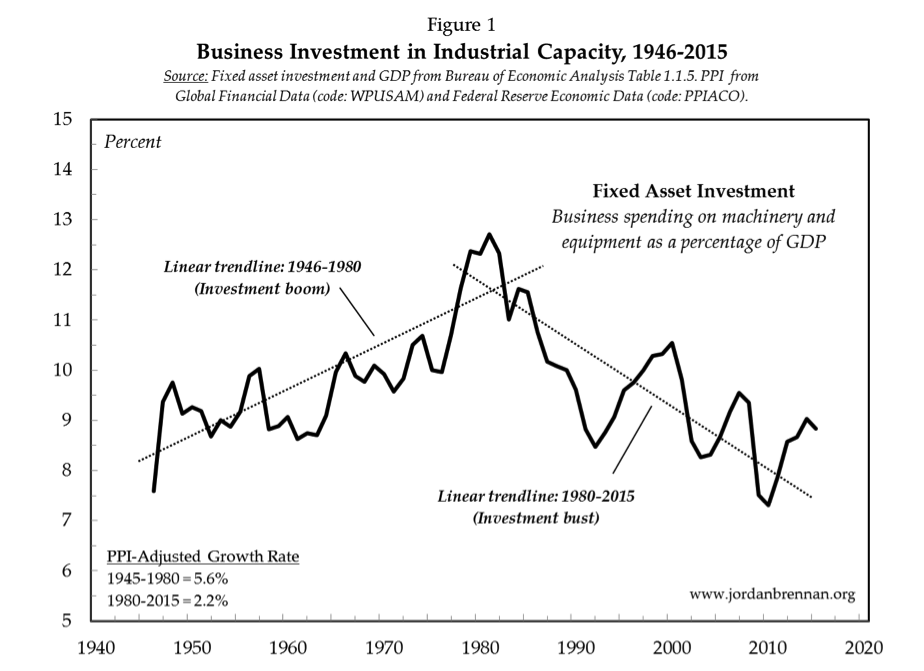
Let’s begin with business investment in non-residential structures, machinery and equipment, which is plotted in Figure 1 as a percentage of GDP over the postwar era. Following the massive demobilization in 1945, business investment in fixed assets steadily rose from eight percent of GDP in 1946 to 13 percent in 1981 before trending sharply downward, having hit a postwar low of seven percent in 2010 before rising to nine percent in 2015. The two linear trend lines moving through the series clearly depict the postwar ‘golden age’ investment boom, which petered out in the early 1980s, and the declining investment share of national income—the ‘investment bust’—in the neoliberal period that followed. The (producer price index-adjusted) average growth rate was more than halved between the two periods, having fallen from 5.6 percent between 1945 and 1980 to 2.2 percent between 1980 and 2015. So while many commentators have claimed that secular stagnation has afflicted the United States since the Great Recession of 2008-09, the data tells us that the deterioration of investment began much earlier and may be associated with neoliberal economic policies. What have been some of the consequences of this slowdown in business investment?
For the ordinary citizen, ‘the economy’ is first and foremost their job and what their household income affords them in the way of purchasing power. And while there is a non-linear relationship between income and overall life satisfaction (meaning the latter rises up to a point with the former), higher income people are better off than lower income people when it comes to both life evaluation and emotional well-being. This is why the growth rate of job creation and personal incomes are such important policy issues: they have a direct connection to the quality of human life, and by extension, the value of democratic citizenship.
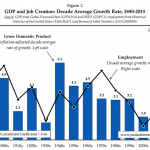
Figure 2 plots the decade average growth rate of GDP (adjusted for inflation) and employment from 1890 through 2015. Unsurprisingly, the two variables are closely associated and register a Pearson correlation coefficient of 0.66 over 125 years. In the Keynesian era (1930s through the 1970s), the rate of job creation and GDP growth were both comparatively high and/or rising. In the neoliberal era (late 1970s to the present) both metrics were lower and/or decelerated. This periodization is very broad, of course. Some periods after 1980 contained exceptionally high levels of growth (say, the expansion between 1995 and 2001), but when we compare the 15 years since 2000 with the previous half-century, we find that the growth rate of both job creation and GDP were roughly halved.
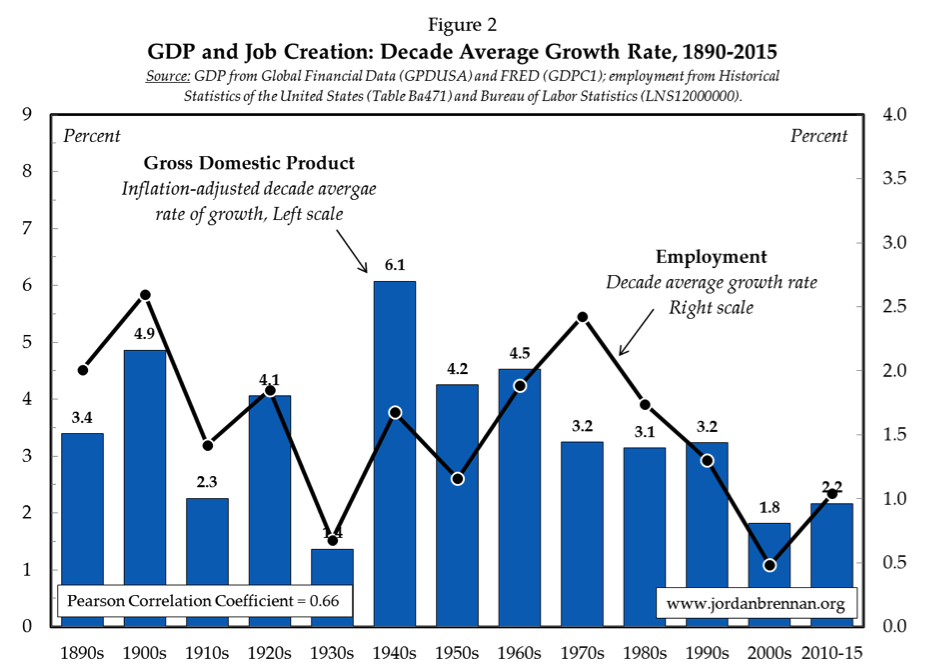
It has long been understood that business investment in machinery and equipment is closely associated with job creation, productivity improvements and economic growth (see here and here, for example). So it comes as no surprise that the cyclically-adjusted growth rate of GDP and employment was relatively higher in three decades prior to 1980 than in the three plus decades afterwards. Accounting for this slowdown is tricky. Conventional explanatory variables include a relative aging of the population and weak productivity growth. What is omitted from this story, however, is the way in which resources are being channelled through the U.S. corporate sector, especially large firms.
Off the Chart: The Recent History of Mergers and Acquisitions
For expansion-oriented businesses, there is a basic calculus to be made: build new industrial capacity in the form of fixed asset investment or buy existing industrial capacity on the market for corporate control (via mergers and acquisitions—M&A hereafter). Given that the former process is closely associated with job creation and GDP growth, it may validly be thought of as falling under the category ‘Production’. M&A is an entirely different process insofar as it does not add to industrial capacity. In fact, M&A is often associated with the reduction of both industrial capacity and net employment, as duplicated functions within the newly merged enterprise are eliminated. Because M&A is a process that merely shuffles control of existing productive capacity between proprietors, it is best conceived as falling under the theoretical category of ‘Distribution’.
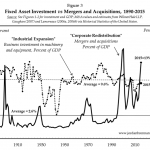
Figure 3 plots the deep history of fixed asset investment and M&A in the United States, both as a percentage of GDP. Three features about the chart command attention. First, with the exception of the depression-laded 1930s and State-led war mobilization of the 1940s, the downturn in U.S. business investment since 1990 has been exceptional. The fixed asset investment share of GDP has averaged 10 percent over the past 125 years, and the past two decades has seen investment levels consistently below that long-term average.
The second feature to note is the wave-like pattern of M&A. The narrative around the development of M&A is one of a series of ‘waves’, with each wave leading to different organizational forms and market structures. The first U.S. merger wave began after the depression of 1883 and lasted until 1904. The major form that M&A took was ‘horizontal’, meaning that firms combined with competitors in their own industries to form monopolistic market structures. The second U.S. merger wave lasted from 1916-1929 and was christened the ‘oligopoly wave’ by Nobel laureate George Stigler because vertical mergers—combinations in the same sector amongst firms that stand in a buyer-seller relationship—predominated. The third U.S. merger wave lasted from 1965-1969 and was baptized the ‘conglomerate wave’ because large firms diversified their holdings by acquiring firms in unrelated sectors. The merger wave after the 1980s has been increasingly global in scope, with large firms absorbing rivals in other jurisdictions.
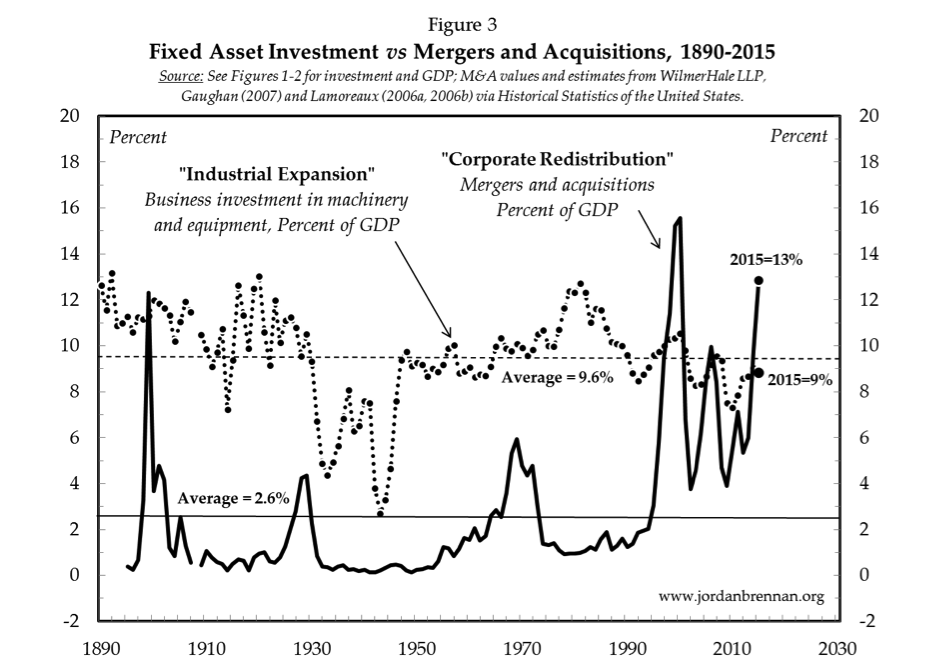
The third and most important feature to note is the surge in M&A activity since 1990. In the past, merger waves were relatively infrequent and, aside from the peak of the wave itself, the scale of merger activity was comparatively insignificant. After 1990, M&A activity is sustained at historically unprecedented levels. Over the past 12 decades, annual M&A as share of GDP averaged less than three percent. However, the average level of M&A more than quadrupled in the quarter-century after 1990 compared with the century prior to 1990. And prior to 1990, M&A activity never came close to eclipsing the value of fixed asset investment (save just one year—1899). After 1990, the scale of M&A begins to rival, if not outpace, that of fixed asset investment. Clearly this is a historic shift in American capitalism.
This creates a set of puzzles. Why did the historic pattern of M&A break down after 1990 and what have some of the macroeconomic consequences been? At a minimum, explanations for M&A usually try to account for two things: merger motives (causes) and post-merger outcomes (effects). Growth and efficiency (the latter often described as operating of financial ‘synergies’) are two of the most common motivations cited for M&A activity, but from a heterodox perspective the larger relative firm size and attendant market power that greater size bestows is the real amalgamation prize.
Market Structure and Market Power
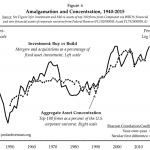
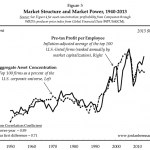
By capturing the overall position of large firms in the corporate universe, many heterodox economists have utilized aggregate concentration as a broad proxy for power of oligopolistic firms. Figure 4 contrasts the scale of merger activity with aggregate asset concentration, the latter measured as the total assets of the top 100 U.S.-listed firms as a percent of the corporate universe. In this chart, merger activity is benchmarked against fixed asset investment, thus capturing the ‘buy or build’ decision. Theoretically, sustained periods of M&A should restructure the corporate sector in a way that elevates asset concentration. Sustained periods of fixed asset investment, by contrast, should lead to a dispersion of corporate asset ownership, as new firms enter the industrial space. The two series in Figure 4 are tightly and positively intertwined over six decades, both on a year-over-year basis (Pearson correlation value of 0.78) and when adjusted to capture the secular (10-year moving average) first difference (a correlation of 0.58). This adds considerable empirical support to the theoretical claim that that amalgamation tends to concentrate corporate asset ownership.
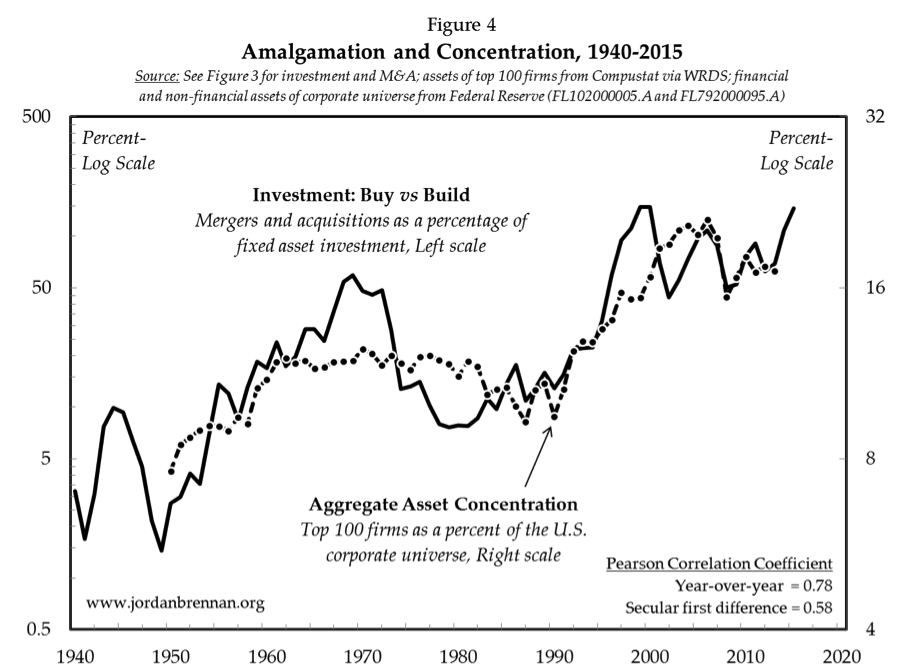
In tandem with the conglomerate merger wave of the late 1960s, asset concentration increased by one-half between, rising from 8 to 12 percent of total corporate assets. Merger activity remained relatively low between 1970 and 1990. Theoretically, then, the fixed asset investment in those two decades should have led to a diffusion of corporate asset ownership. The facts support this interpretation. Between 1970 and 1990, asset concentration fell by one-quarter. With the onset of the most sustained period of merger activity in U.S. corporate history, asset concentration more than doubled, rising from 9 percent in 1990 to 21 percent by 2006. There are millions of registered corporations in the U.S., but the 100 largest firms control one-fifth of total corporate assets, which is a remarkably high degree of concentration.
Is there an empirical relationship between market structure and market power? The fact that sustained periods of M&A are closely associated with the creation of a concentrated market structure implies that the drive for market power is one possible merger motive. However, the fact of enhanced market power would add considerable weight to this claim. I have pursued this line of inquiry in a more fulsome way for the United States (here and here) and for Canada (here and here, for example) and found there to be a linear relationship between amalgamation and aggregate concentration, on the one hand, and aggregate concentration and the market power of oligopolistic corporations, on the other. Does it follow that the concentration of corporate ownership leads to an increase in the size-adjusted profitability of the top 100 U.S.-listed firms—the latter understood as a proxy for market power?
Get Evonomics in your inbox
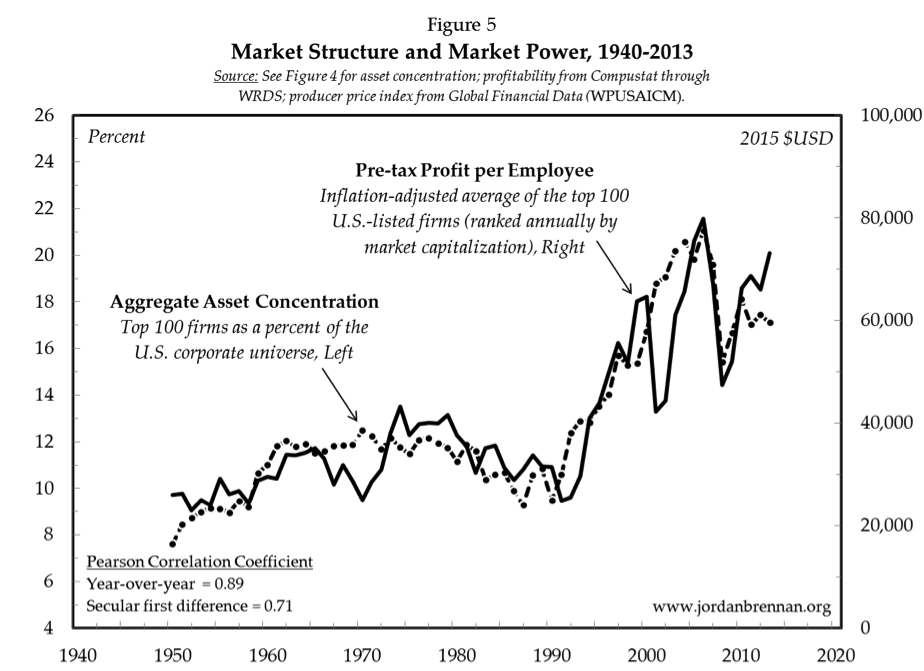
We would assume that as corporate assets concentrate, the top firms would claim a larger share of corporate profit. By adjusting for firm size we approximate what Mancur Olson called the ‘cartelistic power per capita’ of an organization, thereby getting a view into the market power of large firms. Figure 5 contrasts aggregate asset concentration (market structure) with the pre-tax profit per employee (market power) of the largest 100 U.S.-listed firms, ranked annually by market capitalization. The two series are tightly synchronized and register a year-over-year correlation of 0.89 over six decades and a secular first difference correlation of 0.71, which strongly supports the notion that market structure and market power are linked.
The size-adjusted profitability of the largest firms remained relatively stable between 1950 and 1990, ranging from a low of $23,000 per employee in 1954 to a high of $43,000 in 1974 (the tail end of the conglomerate merger wave). Profitability soared after 1990 in tandem with the largest merger wave in U.S. history, rising from $31,000 per employee in 1990 to $80,000 per employee in 2006. This statistical relationship helps explain the motivation to merge. After all, concentration for its own sake is a questionable goal. But if concentration leads to an increase in market power and this market power enables firms to increase their (size-adjusted) profitability, then this provides the business rationale for M&A. In a recent study, the Federal Reserve Board concluded the same thing, namely that M&A is positively associated with market power, but is statistically unrelated to improvements in productivity.
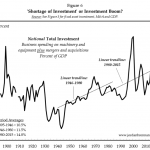
Is there a Shortage of Investment?
Rounding back on the issue of secular stagnation, it seems clear that depressed levels of fixed asset investment play an important role in the slowdown of GDP growth. The claim I want to make here is that the historically unprecedented redirection of funds away from industrial expansion (fixed asset investment) in favour of corporate ownership redistribution (via M&A) has led to a perceived shortage of investable funds. The American corporate sector has ploughed enormous resources into amalgamation, which has led to a highly concentrated market structure and elevated levels of market power. Let’s imagine that all the business spending on M&A was instead ploughed into fixed asset investment; what would the pattern look like over the past century?
Figure 6 combines fixed asset investment with M&A as a share of GDP. This ‘notional’ total investment series indicates the different ways that firms can deploy available assets for the sake of growth. The notional investment series shows that if the corporate sector had spent all its M&A resources on fixed asset investment, the investment boom between 1945 and 1980 would have been a good deal more modest, in relative terms, than it actually was. And rather than the U.S. economy having experienced a deterioration of investment after 1980, it would have witnessed a historically unprecedented investment boom.
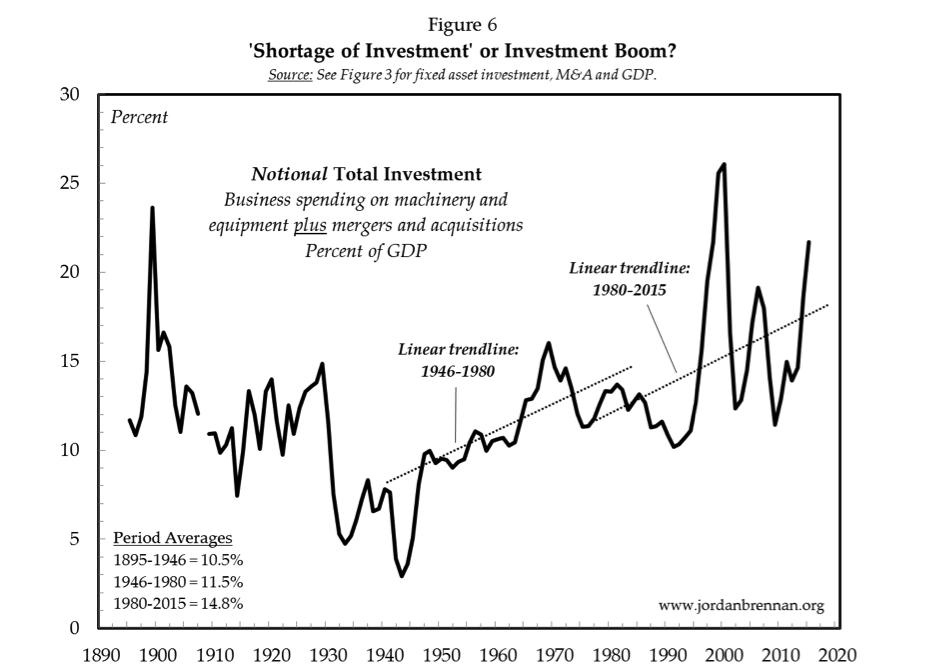
Actual fixed asset investment peaked in 1981 at 13 percent of GDP, but notional total investment peaked in 1999 at 26 percent of GDP and, as of 2015, stood at 22 percent. Given that investment in machinery and equipment is a key driver of employment and economic output, it seems reasonable to suppose that the explosion of M&A activity after 1990 is at least partly responsible for the downward pressure on GDP growth. These facts are obviously not meant to be conclusive; instead, they are meant to shine light on a phenomenon that has not received the scholarly attention it deserves. A macroeconomic problem as complex as secular stagnation would almost certainly have multiple causal elements. It seems that soaring M&A is one such element.
2017 February 19
Sources Cited
Gaughan, P.A., 2007. Mergers, Acquisitions, and Corporate Restructuring. Fourth Edition. Hoboken, NJ: John Wiley & Sons.
Lamoreaux, N.R., 2006a. ‘Mergers, acquisitions, and joint ventures – number and assets: 1919–1979’, in S.B. Carter, S.S. Garter, M.R. Haines, A.L. Olmstead, R. Sutch and G. Wright, eds., Historical Statistics of the United States, Earliest Times to the Present: Millennial Edition. New York: Cambridge University Press, Table Ch422-429. Available online at: http://dx.doi.org/10.1017/ISBN-9780511132971.Ch416-43910.1017/ISBN-9780511132971.Ch416-439. Accessed on May 5, 2015.
Lamoreaux, N.R., 2006b. ‘Mergers in manufacturing and mining – entities, capitalization, and type: 1895–1930’, in S.B. Carter, S.S. Garter, M.R. Haines, A.L. Olmstead, R. Sutch and G. Wright, eds., Historical Statistics of the United States, Earliest Times to the Present: Millennial Edition. New York: Cambridge University Press, Table Ch416-421. Available online at: http://dx.doi.org/10.1017/ISBN-9780511132971.Ch416-43910.1017/ISBN-9780511132971.Ch416-439. Accessed on May 5, 2015.
Wilmer Cutler Pickering Hale and Dorr LLP, 2014. 2014 M&A Report. Available online at: www.wilmerhale.com/2014MAreport. Accessed on May 5, 2015.
Donating = Changing Economics. And Changing the World.
Evonomics is free, it’s a labor of love, and it's an expense. We spend hundreds of hours and lots of dollars each month creating, curating, and promoting content that drives the next evolution of economics. If you're like us — if you think there’s a key leverage point here for making the world a better place — please consider donating. We’ll use your donation to deliver even more game-changing content, and to spread the word about that content to influential thinkers far and wide.
MONTHLY DONATION
$3 / month
$7 / month
$10 / month
$25 / month
You can also become a one-time patron with a single donation in any amount.
If you liked this article, you'll also like these other Evonomics articles...
BE INVOLVED
We welcome you to take part in the next evolution of economics. Sign up now to be kept in the loop!
