


Editor’s Note: In an effort to center New Economic Thinking in the discussion of the COVID-19 crisis, we’ve curated a list of Evonomics articles relevant to this moment—including this one. Check out the full list here.
9 January 2016
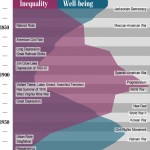
The world is slowly reaching the conclusion that income inequality is toxic for human welfare. Books such as The Spirit Level, Why Nations Fail, and Capital in the 21st Century make the case at the macro scale by chronicling the fate of nations. In the United States of America, income inequality has swung like a slow pendulum, reaching an extreme during the Gilded Age and today. Well-being has swung in the reverse direction, as shown in this remarkable graph compiled by Evolution Institute Vice President Peter Turchin (go here for details).

Inverse relationship between well-being and inequality in American history. The peaks and valleys of inequality (in purple) represent the ratio of the largest fortunes to the median wealth of households (the Phillips curve). The blue-shaded curve combines four measures of well-being: economic (the fraction of economic growth that is paid to workers as wages), health (life expectancy and the average height of native-born population), and social optimism (the average age of first marriage, with early marriages indicating social optimism and delayed marriages indicating social pessimism).
A new study1 provides more evidence for the toxic effects of inequality, if more is needed. A team of economists led by Robert H. Frank measured changes in income inequality in each of the states and in the 100 most densely populated counties in America during the period 1990-2000. Income inequality was measured in two ways—the familiar GINI index and the ratio of the 90th percentile household income to the 50th percentile household income (P9050ratio). Well-being measures included non-business bankruptcy rates, the proportion of the adult population that is divorced, and the proportion of workers whose daily commute is an hour or more. The first two measures are obviously indicative of financial and other forms of stress. The rationale for the third measure is that most people do not want to commute more than an hour to work if they can afford to live closer. As with all good research of this sort, a host of other variables were controlled for.
The results spoke loud and clear: The states and counties that experienced the largest increases in income inequality between 1990-2000 also experienced the largest increases in bankruptcies, divorces, and long commutes.
Get Evonomics in your inbox
The new study zooms in on the bottom slice of Turchin’s graph and confirms the same trend using different methods and much more data. This adds confidence to what Turchin’s graph already shows, but for me the new study packs a more powerful emotional punch than the other studies. Comparisons of nations and 200 years of American history are one thing. The steady drip, drip, drip of inequality eroding the fabric of American life in every state and county, year in and year out, is another. Those three measures of well-being were chosen because of the availability of data. Think of all the other manifestations of stress that are also increasing in front of our eyes, once we know what to look for. That is the import of the new study. In common language, everyone in America and the world needs to know—and inform their elected officials—that inequality sucks.
- Frank, R. H., Levine, A. S., & Dijk, O. (2014). Expenditure Cascades. Review of Behavioral Economics, 55–73. http://doi.org/10.1561/105.00000003
Donating = Changing Economics. And Changing the World.
Evonomics is free, it’s a labor of love, and it's an expense. We spend hundreds of hours and lots of dollars each month creating, curating, and promoting content that drives the next evolution of economics. If you're like us — if you think there’s a key leverage point here for making the world a better place — please consider donating. We’ll use your donation to deliver even more game-changing content, and to spread the word about that content to influential thinkers far and wide.
MONTHLY DONATION
$3 / month
$7 / month
$10 / month
$25 / month
You can also become a one-time patron with a single donation in any amount.
If you liked this article, you'll also like these other Evonomics articles...
BE INVOLVED
We welcome you to take part in the next evolution of economics. Sign up now to be kept in the loop!
