


By Ed Dolan
In the first post in this series, I examined the effect of the size of government on freedom and prosperity. Using indicators of economic freedom, personal freedom, and prosperity for a sample of 144 countries, I arrived at two significant results. First, I found that the data showed economic freedom to be positively associated with both personal freedom and prosperity. Second, I found that greater personal freedom and prosperity were associated with larger, not smaller, governments.
This post digs deeper into the data by constructing a measure of the quality of government. It turns out that the apparently positive effect of larger government on freedom and prosperity arises from a positive association between the size and quality of government. Quality of government affects freedom and prosperity much more strongly than simple size.
Measuring the Quality of Government
Both this post and its predecessor rely on three data sets. The first is the Economic Freedom Index (EFI) from the Fraser Institute, which includes measures of the size of government, protection of property rights, sound money, freedom of international trade, and regulation. The second is the Personal Freedom Index (PFI) from the Cato Institute, which covers rule of law, freedom of movement and assembly, personal safety and security, freedom of information, and freedom of personal relationships. The third is the Legatum Prosperity Index (LPI) from the Legatum Institute. The LPI includes data on nine “pillars” of prosperity, including the economy, business environment, governance, personal freedom, health, safety and security, education, social capital, and environmental quality. This post also makes reference to Cato Institute’s Human Freedom Index (HFI), which is simply the average of the EFI and the PFI. The links provide detailed information on sources and methodology for all of these indexes.
Each index, in its own way, contains one or more components that bear on the quality of government:
- The economic freedom index includes a component called “legal system and property rights,” which is constructed from indicators of judicial independence, impartiality of courts, and protection of property rights. According to Fraser’s methodological notes, data for these are drawn from the World Economic Forum’s Global Competitiveness Report. A fourth subcomponent measures the degree of military interference in rule of law and politics. Data for that indicator come from International Country Risk Guide from the PRS Group, supplemented as needed by governance indicators from the World Bank.
- The personal freedom index has a “Rule of Law” component that uses less narrowly economic indicators than those in the EFI. Drawing on the World Justice Project’s Rule of Law Index, the PFI’s rule of law component includes indicators of procedural justice, civil justice, and criminal justice. These subcomponents consider factors such as adherence to due process and the presumption of innocence, the risk of arbitrary arrest, and the degree to which civil and criminal courts are subject to corruption and improper government influence.
- The Legatum prosperity index includes a “governance” component that covers additional measures of rule of law along with other factors. The individual indicators of which it is composed include measures of confidence in the government and elections; the corruption perceptions index from Transparency International; a measure of the level of democracy; and an overall measure of government effectiveness from the World Bank’s Doing Business survey.
Each of these indicators has a slightly different perspective on the quality of government. Despite their differences, however, they are highly intercorrelated. The pairwise correlation coefficients are 0.87 for the Cato and Fraser indicators, 0.89 for the Cato and Legatum indicators, and 0.83 for the Fraser and Legatum indicators. For purposes of this post, I combine the Fraser, Cato, and Legatum indicators into an equally weighted average that I will refer to as the quality of government indicator, or QGOV. In nearly all cases, QGOV has statistically greater explanatory power than any one of its components taken individually.
Keep in mind that when I describe QGOV as a measure of “quality” of government, I am using a kind of shorthand to refer to a narrow set of mostly procedural qualities. I think most readers will agree that governments with honest courts that protect property rights, uphold contracts, shun corruption, and respect due process are “better” than those that do not. Many people would like to live under a government that does other things, too—say, one that defends gender equality or promotes traditional values. A high QGOV score does not pretend to measure those qualities.
Quality of Government and Freedom
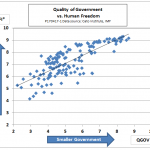
Our measure of the quality of government is strongly correlated with Cato’s Human Freedom Index, as well as with its personal and economic components. We have to be careful in assessing the strength of those relationships, however. Keep in mind that the Fraser Institute’s property rights indicator is included in the EFI, that Cato’s rule of law indicator is included in the PFI, and both are also included in our measure QGOV. A simple correlation of QGOV with HFI would be biased upward if we did not adjust for the overlap. Accordingly, in further analysis I omit the rule of law component from the PFI to get an adjusted index of personal freedom, PFI*. Similarly, I omit the property rights subcomponent from the EFI to get EFI*and omit both components from the HFI to get HFI*. Later, I also omit the governance component from the LPI to get LPI*. The simple correlations of these indexes with QGOV are 0.59 for PFI*, 0.86 for EFI*, and 0.79 for HFI*.
The following figure provides a scatterplot of quality of government against the adjusted human freedom index:

Not surprisingly, wealthier countries tend to have higher-quality governments. The correlation of QGOV with the log of GDP per capita is 0.73. We can control for that effect by running a multiple regression that includes per-capita GDP. When we do so, the quality of government continues to have a statistically significant positive effect on the human freedom index, and also on both its personal and economic components.
Quality of Government and Prosperity
In the preceding post, economic freedom has a strongly positive relationship to prosperity, as measured both by the Legatum Prosperity Index as a whole and by a sub-index composed of its education, health, and safety components. The simple correlations were 0.72 for EFI and LPI, and 0.68 for EFI and EHS. Now we turn to the question of whether prosperity is also related to quality of government as measured by our QGOV indicator.
The following scatterplot shows the overall picture. The horizontal axis shows QGOV. Since the Legatum governance component is already a part of our QGOV indicator, the vertical axis shows the adjusted version of the prosperity index, LPI*, which omits the governance component of the original index.

The simple correlation of QGOV and LPI* is an impressive 0.90. The relationship between QGOV and the education, health, and safety index EHS (not shown) is nearly as tight, with a simple correlation of 0.83.
Because both QGOV and LPI* are positively correlated with GDP per capita, we need to control for the latter to verify the statistical significance of the relationship shown in the chart. In a multiple regression of LPI* on QGOV and the log of GDP per capita, the slope coefficients are statistically significant at the 0.01 level for both dependent variables. The overall correlation rises from 0.90 to 0.92 when GDP is included. Each 1-point increase on the 10-point quality of government scale is associated with a 4.2-point increase along the 100-point prosperity scale.
Quality of government vs. size of government
Next, we come to the issue of the relative effects of the quality of government vs. the size of government, as measured by our data. We use two alternative indexes of the size of government. One, abbreviated SGOV, is derived from IMF data on government expenditures (both consumption and transfers) as a percentage of GDP. The other, abbreviated SoG, is a component of Fraser’s economic freedom index. It is built up from sub-components measuring government consumption, transfers, government investment, and tax rates. Following the practice of the Fraser and Cato data sets, we measure the size of government, in both the SGOV and SoG versions, on a scale of 0 to 10, with a larger index value indicating a smaller government.
In the preceding post, we found that both size of government indexes correlated negatively with measures of freedom and prosperity, contrary to what most libertarians would expect. We now look more closely into that result, taking into account the quality as well as the size of government.
We can begin by comparing simple scatterplots of size and quality of government versus the human freedom index. The plots use SGOV as the size variable and HFI* as the freedom variable.

As the charts show, greater human freedom is associated with better quality and larger size of government, with a considerably stronger correlation for quality than size. However, simple correlations like this need to be interpreted with caution, as there are complex intercorrelations among multiple variables. In this case, we have a correlation of -0.42 between SGOV and QGov, that is, a tendency for larger governments to have a higher index of quality. We also have a correlation of 0.74 between QGOV and the log of GDP per capita (richer countries have higher-quality governments) and -0.48 between SGOV and the log of GDP per capita (richer countries have relatively larger governments).
We can use multiple regression to untangle these interactions, using HFI* as the independent variable and using QGOV, SGOV, and the log of GDP per capita as the dependent variables. When we do so, we get a strongly statistically significant positive coefficient on QGOV and no statistically significant relationship at the 0.01 confidence level for the other two variables. The overall correlation is 0.79, essentially the same as for the two-variable relationship shown in the left-hand scatter plot above.
If we use Fraser’s SoG component instead of SGOV as our measure of the size of government, we get essentially the same result: The association of SGOV with HFI* remains strongly positive, while neither GDP nor the size of government has a statistically significant effect.
Our conclusion: Quality of government has a strong positive association with human freedom, at least to the extent that our indicators measure these things. When all three dependent variables are considered together, the apparent association of larger government with less freedom disappears. As far as human freedom goes, the quality of government dominates the statistical relationship. Other things being equal, statistical measures of the size of government such as tax rates and the share of GDP devoted to government spending fade to insignificance when compared with protection of property rights, due process, and the other elements that go into our measure of quality.
We can do the same exercise using the Legatum prosperity index as our dependent variable. As before, we use the LPI* version, since we do not want to include Legatum’s governance component as part of both the independent variable and the dependent variable QGOV. Here are the scatter plots:

As before, to sort out the interactions among the variables, I use a multiple regression with LPI* as the dependent variable and QGOV, SGOV, and the log of GDP per capita as independent variables. The result this time differs in one respect. As before, we find that QGOV has a strong positive association with LPI*, while SGOV has no statistically significant relationship. This time, however, GDP per capita also has a positive and statistically significant effect on the dependent variable. The overall correlation for the multiple regression is 0.93, slightly higher than for the two-variable scatter plot. The results are essentially the same when we use SoG instead of SGOV as our measure of the size of government, and when we use the education-health-safety variable EHS as our measure of prosperity.
Our conclusion: Quality of government and GDP per capita both have strongly positive effects on prosperity, as measured by the adjusted Legatum prosperity index or by an index of education, health, and personal safety. However, other things being equal, the size of government, at least as we measure it, has no statistically significant independent impact on prosperity one way or the other.
Size and Quality of Government by Country
So far, we have dealt exclusively in correlations and general tendencies. Before we conclude, it seems worth looking, at least briefly, at the relationship between the size and quality of government country by country.
The following figure sets the stage by adding labels to some of the data points. The red lines divide the figure into quadrants according the median values for size and quality of government. A trend line runs roughly from France to Nigeria. The correlation between the two variables, -0.48, is not especially strong, but it is statistically significant.

The governments with the highest quality scores are found in the northwest quadrant. It is no surprise to find a cluster of Scandinavian countries there, with some of their fellow EU members not far away. Farther to the right lie New Zealand and Switzerland (CHE), two countries with well-run governments that are close to the median size. The US government is also close to median size. Its quality score is a little lower, but still well above the trend line. In the same quadrant, but below the trend line—large but lower-quality governments—we find Kuwait and Saudi Arabia. Some of the other Gulf States are in the same neighborhood.
The northeast quadrant is more sparsely populated. The outliers here are Singapore and Hong Kong, countries with governments that are well run, but small in terms of expenditures. South Korea also falls into this quadrant, as does Ireland, which has a well-run government that is relatively small by EU standards.
Moving to the southeast quadrant, we find countries that have small but low-quality governments, such as Nigeria, Democratic Republic of Congo, Chad, Central African Republic, Bangladesh, and others. These countries are also among the poorest on the planet in terms of per-capita GDP and human development.
Finally, in the southwest quadrant, we find the sorry example of Venezuela—this decade’s poster child for socialism gone bad. North Korea would probably be nearby, but we don’t have enough data to include it in the sample. Russia and China are also in this quadrant, but much closer to the center, with both size and quality of government close to the median.
There is not enough room in the diagram to label all countries, or to display more than two variables. Additional data is provided in the following table, which includes size of government (SGOV), quality of government (QGOV), prosperity as measured by the full Legatum Prosperity Index (LPI), and freedom as measured by the Cato Human Freedom Index (HFI).

Conclusions
Some argue that freedom is not only good in itself, but is conducive to other good things—health, enlightenment, safety, and prosperity in all its many forms. Freedom is not easy to measure, however. It has both personal and economic dimensions, with a rich mixture of qualitative and quantitative conditions contributing to each of these.
Researchers at the Cato Institute, the Fraser Institute, the Legatum Institute, and elsewhere have done their best to assemble sets of data that bear on the complex interrelations among the many dimensions of freedom and prosperity. This post and the preceding one have investigated some of the most basic of these, reaching the following conclusions:
- The size of government per se is not an especially useful indicator. Simple correlations based on cross-country data suggest that by and large, people who live in countries with relatively large governments, as measured by the share of GDP devoted to government spending, are better educated, healthier, safer, and generally more prosperous. They also tend to enjoy greater personal freedoms.
- On the other hand, cross-country data on the rule of law, protection of property rights, and other measures of the quality of government show strong, positive associations with quantitative indicators of freedom and prosperity.
- When size and quality indicators are compared directly, using multivariate analysis that controls for the effects of per-capita GDP, quality dominates. In such tests, the size of government turns out to have little effect one way or the other on most measures of freedom and prosperity.
As in any statistical study, we should be cautious about drawing conclusions about causation. There is nothing in these results to suggest that making a country’s government bigger will automatically make it better. At the same time, it is hard to deny that there is a strong tendency in the cross-country data for larger governments to be better governments, when by “better,” we mean better able to protect property rights, better able to offer impartial civil and criminal justice, and less open to corrupt influences.
Readers are also encouraged to think about the country-by-country data reported in the chart and table above. There is a lot of variety in the world. Too strong a focus either on statistical regularities or on selected outliers can draw us too strongly toward conclusions that, in reality, admit of many exceptions.
For example, the small-government city states of Singapore and Hong Kong are rightly admired for their prosperity and economic freedoms. However, it gives one pause to note how many small-government countries enjoy neither. Chad, Bangladesh, and the Democratic Republic of Congo, labeled in the chart, are just the outliers among a whole cluster of countries in that category.
Similarly, a look at individual countries shows that our statistical indicators of “big” and “small,” or of “good” and “bad,” do not always line up with what we mean by these terms in other contexts. For example, many people in the West would readily name Russia and China as countries with governments that are conspicuously both big and bad. Yet, although Russia and China do fall into the southwest quadrant of our chart, they do so only barely. Statistically speaking, neither country is an outlier on either variable.
This post and the preceding one only scratch the surface of the available data. In future posts, I hope to address many unanswered questions. For example, is it possible to replicate the results reported here from other data sources, such as the indicators of economic freedom from the Heritage Foundation and the indicators of human well-being from the Social Prosperity Index? Do the results reported here for the whole sample also hold for subsets of countries, such as OECD members or those in the lowest income quartile? Also, how important is freedom to trade to personal freedom and prosperity? A preliminary analysis in an earlier post suggests that it is very important, but the question deserves a more thorough treatment. What about regulation and sound money as indicators of economic freedom? Finally, how important are various aspects of economic freedom and quality of government for rates of economic growth, as opposed to levels of freedom and prosperity, which have been our focus so far?
Originally published at the Niskanen Center.
2017 May 6
Donating = Changing Economics. And Changing the World.
Evonomics is free, it’s a labor of love, and it's an expense. We spend hundreds of hours and lots of dollars each month creating, curating, and promoting content that drives the next evolution of economics. If you're like us — if you think there’s a key leverage point here for making the world a better place — please consider donating. We’ll use your donation to deliver even more game-changing content, and to spread the word about that content to influential thinkers far and wide.
MONTHLY DONATION
$3 / month
$7 / month
$10 / month
$25 / month
You can also become a one-time patron with a single donation in any amount.
If you liked this article, you'll also like these other Evonomics articles...
BE INVOLVED
We welcome you to take part in the next evolution of economics. Sign up now to be kept in the loop!
