


By Ed Dolan
Economists, libertarian economists included, love to measure things. The Human Freedom Index (HFI) from the Cato Institute is a case in point. Its authors have assembled dozens of indicators of personal and economic freedom. They invite interested researchers to use them to explore “the complex ways in which freedom influences, and can be influenced by, political regimes, economic development, and the whole range of indicators of human well-being.”
I am happy to accept the invitation. This post, the first of a series, will take a first look at what we can learn from the data about the relationships among freedom, prosperity, and government. The relationships turn out to be not quite as simple as many libertarians might think.
THE DATA
The Human Freedom Index consists of two parts. One is the Economic Freedom Index (EFI) from the Fraser Institute, which includes measures of the size of government, protection of property rights, sound money, freedom of international trade, and regulation. The other is Cato’s own Personal Freedom Index (PFI), which includes measures of rule of law, freedom of movement and assembly, personal safety and security, freedom of information, and freedom of personal relationships. The Cato and Fraser links provide detailed descriptions of the two indexes.
In order to explore the way freedom influences other aspects of human well-being, I will draw on a third data set, the Legatum Prosperity Index (LPI) from the Legatum Institute. The LPI includes data on nine “pillars” of prosperity, including the economy, business environment, governance, personal freedom, health, safety and security, education, social capital, and environmental quality.
Get Evonomics in your inbox
The EFI and PFI cover 160 countries and the LPI 149 countries. In this post I will use the set of 143 countries for which data are available in all three indexes. The Cato, Fraser, and Legatum links above provide detailed methodological information.
ECONOMIC AND PERSONAL FREEDOM
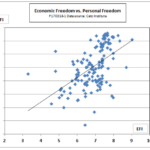
We can begin by confirming a result reported in the introduction to the Cato Human Freedom Index, namely, that economic freedom and personal freedom are closely related. Expressing both indexes on a scale of zero to ten, with ten indicating maximum freedom, a scatterplot of the two indexes looks like this:
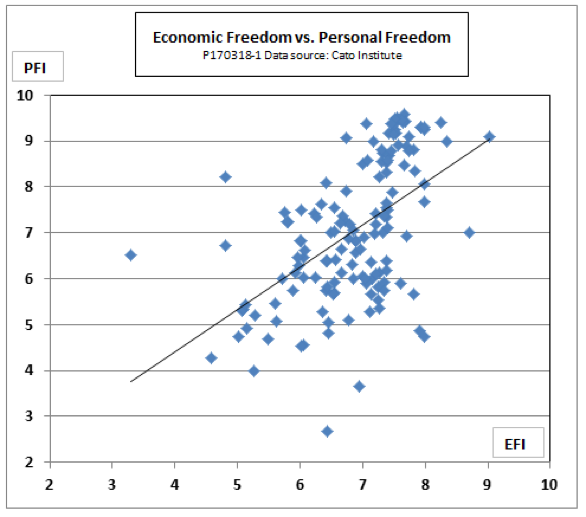
The correlation coefficient between EFI and PFI for the 143 countries in the joint Cato-Legatum sample is 0.53—not an especially tight relationship, but statistically significant. The slope of the trend line is 0.91, meaning that each one-point increase in the EFI score is associated with a 0.91 point increase in the PFI score.
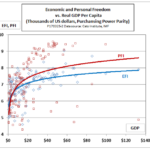
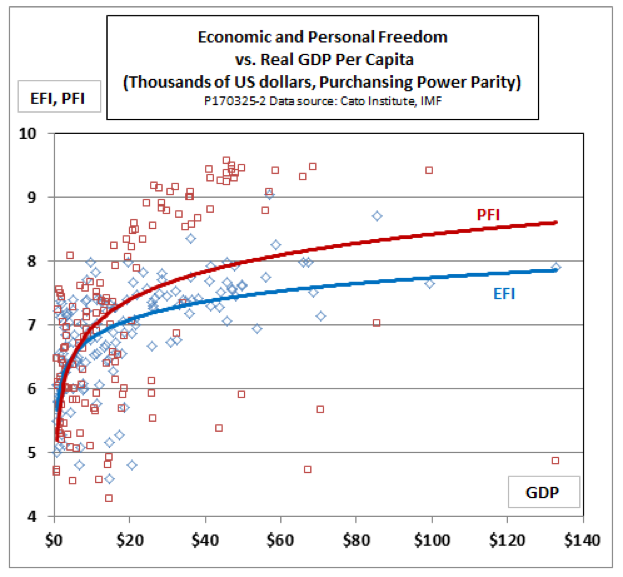
The relationship between economic and personal freedom is partly explained by the fact that both are positively associated with income. As the next chart shows, that relationship is nonlinear for both measures of freedom. The log of real GDP per capita, expressed in U.S. dollars at purchasing power parity, provides a reasonably good fit. The correlation coefficients are 0.51 for log GDP and the personal freedom index, and 0.56 for log GDP and the economic freedom index.
Using multiple regression analysis, we can recalculate the relationship between economic freedom and personal freedom in a way that controls for their common relationship to GDP. Taking GDP into account increases the correlation coefficient between the two aspects of freedom from 0.53 to 0.59, but it also reduces the slope of the relationship between PFI and EFI. Each one-point increase in EFI is now associated with a 0.61 point increase in the PFI rather than the 0.91 point increase that was estimated without including GDP. All of these results are statistically significant at a 0.01 level of confidence.
So far, so good. We have found that personal freedom and economic freedom are positively associated with each other, and that both freedom indexes are positively associated with prosperity as measured by real GDP per capita. Good libertarians should expect these results and be gratified to find them confirmed.
FREEDOM AND PROSPERITY
The previous section showed that economic and personal freedom are positively related to prosperity as measured by GDP per capita, but prosperity is more than GDP. Libertarians tend to see freedom as also conducive to other aspects of human well-being, such as education, health, and personal safety.
There are many measures of prosperity and well-being available. I hope to be able to explore several of them and their relationships to human freedom in future posts. In this introductory treatment, however, I will limit myself to the education, health, and personal security indicators from the Legatum Prosperity Index. In what follows, I will refer to the average of these three Legatum “pillars” as the education-health-safety index, or EHS, measured on a scale of 1 to 100. (By and large, the results reported below also hold for each of the three indicators considered separately, although some of the individual coefficients are not statistically significant.)
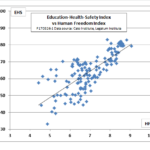
We can begin, as before, with a simple scatterplot of EHS and HFI:
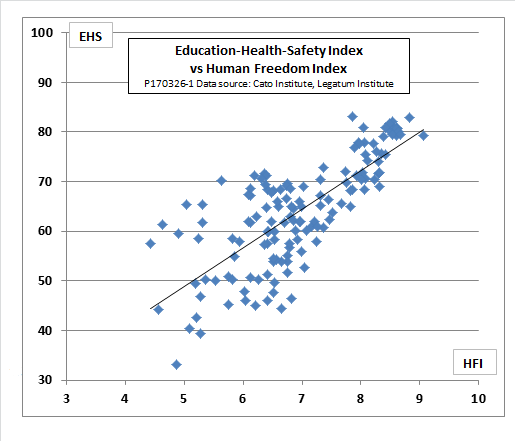
As the chart shows, the relationship between the two variables is positive and strong. The correlation coefficient of EHS and HFI is 0.76. Each of the individual freedom components also correlates positively with EHS, although not quite so strongly: 0.68 for economic freedom and 0.67 for personal freedom.
Since EHS, HFI, and GDP per capita all correlate strongly with per capita GDP, we need to be cautious about interpreting the simple correlation coefficients. For example, it could be that the apparent correlation of EHS with EFI simply reflects the fact that rich countries tend to have good schools, hospitals, and police forces, but that people in rich countries that are free live no better than those in rich countries that are unfree.
We can, again, set our minds at rest by using multiple regression to sort out the individual contributions of each variable. A regression of EHS on EFI, PFI, and the log of GDP per capita yields a strikingly strong result. The overall correlation of EHS and the three variables is an impressive 0.91. Using the coefficient of determination, R2, we can interpret that result as meaning that the three variables jointly explain 83 percent of the variation in education, health, and safety among countries. The contributions of each of the individual independent variables are positive and strongly statistically significant.
It seems, then, that human freedom in both its economic and personal manifestations contributes positively to human well-being as measured by data on education, health, and personal safety—another result sure to please libertarian readers.
THE EFFECTS OF SIZE OF GOVERNMENT ON FREEDOM AND PROSPERITY
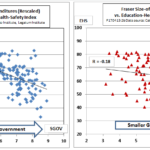
Things get more interesting when we dig a little deeper into the reported linkages between personal and economic freedom by breaking the Fraser Institute’s EFI down into its separate components: size of government, protection of property rights, sound money, freedom of international trade, and regulation. When we look at the simple correlations between the personal freedom index and the EFI components, we find they are all are positive, as expected, except that for the size of government (SoG), which is negative. The correlation of SoG with the personal freedom index is -0.16. Remember that for all components of the EFI, a higher value means more freedom, so the negative coefficient means that a larger government is associated with greater freedom. That is not what most libertarians would expect. Is this just an anomaly or a real statistical regularity?
As a first step toward answering this question, we need to see just what the SoG indicator really measures. SoG is itself a composite derived by averaging four subcomponents: government consumption expenditures, government transfers, marginal tax rates, and something called “government enterprise and investment” (GEI), which is Fraser’s name for the ratio of a country’s government investment to its total investment. Examining these subcomponents uncovers two problems.
One is that only the government consumption indicator is available for all countries. Data on transfers, tax rates, and government investment are missing in several cases. Where data are missing, the SoG measure is the average of the components for which there are data. This approach to handling missing data degrades the statistical power of the SoG indicator as a whole.
By analogy, suppose that we want to assess the health risks facing a city’s residents using their body mass index (BMI), their gender, and their age. To measure BMI, we need to know each person’s height and weight, but suppose we are missing the data on weight for some individuals. Rather than leaving those people out of the sample, we could estimate their weight by using the average weight for a person of a given height, age, and gender. However, that procedure would inevitably make our assessment of health risks less statistically reliable than it would be if we had had complete data for everyone in our sample.
The second problem with SoG is that its GEI subcomponent has a strong negative correlation with the other three subcomponents—government consumption, transfers, and tax rates. Also, if we look at the relationships of the SoG subcomponents with independent variables, such as GDP, GDP growth, health, education, and safety, we find that the correlations for GEI are positive whereas those for the other components are negative. Creating a composite indicator out of subcomponents that correlate negatively with one another and that have opposite relationships to independent variables is a statistically dubious procedure.
Again resorting to analogy, suppose we want to devise a composite indicator of heating efficiency for residential buildings. We know that the size of a building’s windows and the thickness of its walls are relevant variables, but how to combine them? Simply averaging the thickness of the walls of each building and the area of its windows would not give us a reasonable composite indicator, since the two variables have opposite effects on heating efficiency. A house with small windows and thick walls could have the same score as one with large windows and thin walls, even though the former would be far more efficient than the latter. Instead, either we should treat windows and walls as separate variables in a multivariate analysis, or, if it is important to have a single compound indicator, we should reverse the sign on window area before combining it with wall thickness.
My guess is that the people at Fraser who created the economic freedom index never thought about this problem. More likely, they used ideological rather than statistical criteria in formulating the SoG indicator. They probably assumed, a priori, that higher taxes, more government consumption, more transfers, and more government investment all make us less free, and accordingly, assumed that an average of the four would make a good measure of the size of government for their economic freedom index. The result is statistical mush.
None of this means that the size of government is unimportant. It suggests, instead, that Fraser’s SoG indicator is not a statistically sound measure of the size of government. We can check that by comparing SoG with a simpler measure based on the ratio of total government expenditures to GDP, which we will abbreviate as SGOV. The required data are available for all countries in our sample from the IMF World Economic Outlook database. For easier comparison with SoG and with other components of the EFI, I express SGOV on a scale of 0 to 10, with 10 indicating the smallest government. (Specifically, if G is the ratio of government expenditure to GDP as expressed by the IMF on a scale of 0 to 100, then SGOV = (100-G)/10.)
The SGOV indicator turns out to have much more explanatory power than Fraser’s SoG. The correlation of SGOV with the log of GDP per capita is -0.48, compared with -0.25 for SoG. Both correlations suggest that higher levels of GDP are associated with larger government sectors and both coefficients are statistically significant, but the association is stronger for SGOV, derived from the simple ratio of government expenditure to GDP, than for Fraser’s original SoG indicator.
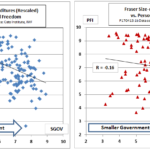
Turning to the personal freedom index, the simple correlation of SGOV with PFI is -0.39, compared to – 0.16 for SoG. Both indicators suggest that personal freedom increases as the size of government increases, but the coefficient for SGOV is larger, and it is statistically significant, whereas that for SoG is not. Here are scatter plots for the two measures of the size of government vs. the personal freedom index:
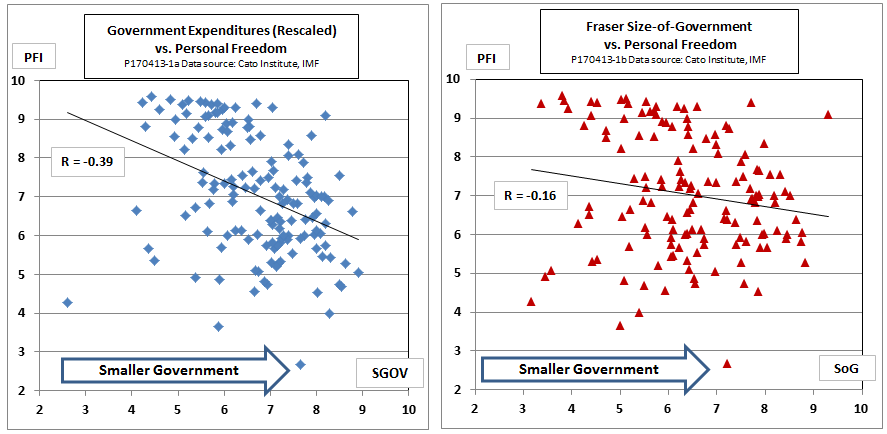
As in earlier cases, we should not rely solely on the simple correlation, which is attributable in part to the fact that both the size of government and personal freedom correlate strongly with GDP per capita. We can get a more accurate picture by using a multiple regression to control for GDP. A regression of PFI on SGOV and the log of GDP per capita shows a correlation of 0.53, with all coefficients significant at the 0.01 level. The slope estimate indicates that on average, a one point decrease in SGOV is (that is, a one-point movement toward larger government) is, on average, associated with a quarter-point increase in personal freedom.
As a further test of the relative statistical power of the two indicators, I ran a multiple regression of PFI on both SGOV and SoG, plus the log of GDP per capita. When both measures of the size of government were included, the relation of SGOV to PFI was positive and statistically significant but SoG had no statistically significant relation to PFI.
Finally, I got similar results when I used the EHS measure of prosperity as the independent variable. The correlation coefficient for EHS and SoG is -0.18, indicating a tendency for larger government sectors to be associated with greater prosperity, but the absolute value of the coefficient is too small to be statistically significant. The correlation of EHS with SGOV is -0.48. In this case, the value of the coefficient is statistically significant and the negative sign again indicates a tendency for countries with larger governments to have higher scores for education, health, and personal safety. Here are the scatterplots:
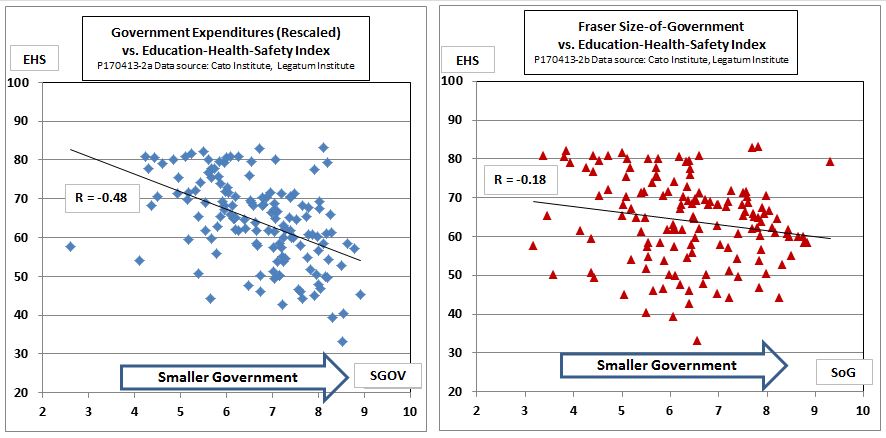
As before, we can refine the results from the simple correlations using a multiple regression, controlling for GDP per capita. Doing so shows that SGOV, the ratio of government to GDP, has a negative and statistically significant association with EHS, showing that larger government is associated with higher levels of education, health, and personal safety. However, SoG, Fraser’s size-of-government measure, has no statistically significant association with EHS.
CONCLUSIONS
Our statistical investigations lead to two substantive conclusions:
- First, the data appear to support notion that economic freedom makes a positive contribution to personal freedom and prosperity. That holds true whether we measure prosperity in a narrowly economic sense, as GDP per capita, or in a broader sense, using noneconomic indicators of education, health, and personal safety.
- Second, the data do not support the notion that a larger government is necessarily detrimental to either freedom or prosperity. On the contrary, countries with larger government sectors tend to have more personal freedom and higher indicators of education, health, and personal safety.
These findings suggest that libertarians need to do some further thinking about “Our Enemy, the State,” as Albert Jay Nock expressed it in the title of his classic book.
Get Evonomics in your inbox
On a purely technical level, the analysis also suggests that the authors of the Fraser Institute’s economic freedom index need to rethink their size-of-government indicator, which appears to me to have serious methodological flaws that undermine its statistical value. A simpler indicator, based on the ratio of government expenditures to GDP, has significantly greater explanatory power in a variety of circumstances.
More broadly, we need think in a more nuanced way about the potential threat that government poses to freedom and prosperity. Size of government alone is an inadequate measure of the threat. The results we have reported do not just hold for a few outliers like France and Sweden that are relatively free and prosperous despite having large governments. Rather, an association of freedom and prosperity with large governments is a general tendency that holds across countries at all levels of income and in all parts of the world.
Originally posted at Niskanen Center.
2017 April 24
Donating = Changing Economics. And Changing the World.
Evonomics is free, it’s a labor of love, and it's an expense. We spend hundreds of hours and lots of dollars each month creating, curating, and promoting content that drives the next evolution of economics. If you're like us — if you think there’s a key leverage point here for making the world a better place — please consider donating. We’ll use your donation to deliver even more game-changing content, and to spread the word about that content to influential thinkers far and wide.
MONTHLY DONATION
$3 / month
$7 / month
$10 / month
$25 / month
You can also become a one-time patron with a single donation in any amount.
If you liked this article, you'll also like these other Evonomics articles...
BE INVOLVED
We welcome you to take part in the next evolution of economics. Sign up now to be kept in the loop!
