


By Steve Roth
May 18, 2018
The shares of income going to “capital” and “labor” are vexed issues. How much is received for doing work, and how much is unearned “property income”— interest, dividends, etc.? For a long time, economists thought these relative shares stayed roughly unchanged over time. But since the 70s, and especially since 2000, the share going to owners of capital has been increasing, while labor’s share has gone down.
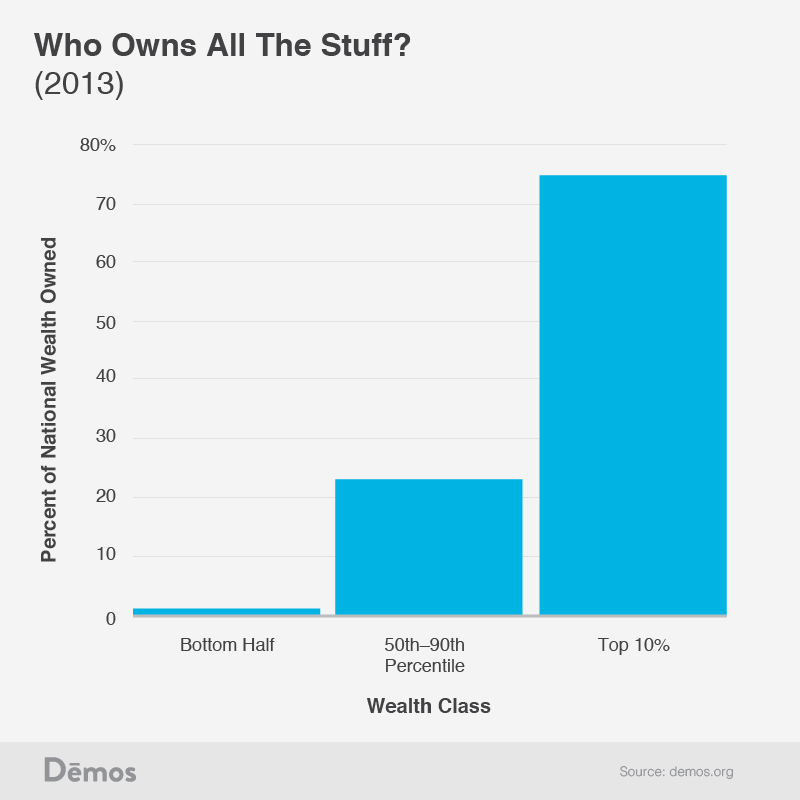
People get income for doing stuff, and they get income for owning stuff. Increasingly the latter. And the ownership share of income goes to a small slice of households that own almost all the stuff.
The labor and capital-share measures you commonly see start by measuring total labor compensation — wages, salaries, and benefits. That’s labor’s share, in dollars. Subtract labor share from GDP, and you get the share of GDP going to owners (to “capital”). Owners’ share isn’t measured, it’s just a residual: GDP minus labor compensation.
Get Evonomics in your inbox
There are some gray areas. What counts as “labor compensation”? But in the big accounting scheme of things, they’re pretty small. Little of Jeff Bezos’ and Bill Gates’s wealth, for instance, came from wages, salaries, and benefits — what the IRS classifies as “earned” income. It came from owning stock. But you can still say it’s ultimately a result of their labor — their work, smarts, and effort. Even if you grant that, though, we’re talking very small numbers: their total wealth, combined, accumulated over two to four decades, is hardly a rounding error — a bit over one percent — on one year’s total household income.
Bottom line: National accountants do impressive yeoman’s work here; “labor compensation” is a pretty solid empirical measure of what workers receive for working. And the remaining income is a good measure of what people receive for owning stuff.
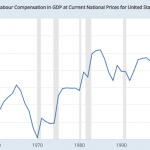
Here’s a typical measure of capital share, as a percent of GDP — here just 1 – labor share percentage. (Note that this not an official U.S. measure, from the BEA or BLS; it’s from University of Groningen researchers.)

Owners’ share has increased from roughly 36% in the fifties to 40% today, an 11% increase — significant, but not eye-popping. (If you’re interested, the New York Times just published an imperfect but very interesting look at these shares, company-by-company.)
But what’s weird about this picture right off: GDP ($19.4T in 2017) does not equal household income ($14.6T). So you’re not seeing labor income (which all goes to households) as a share of household income.
The accounting gymnastics to jump that $5T sector gap require rather heroic economic assumptions — about factor contributions to production, variously imputed “rental” payments for capital, “factorless” income, etc. It’s hard to peer through all that theory and manipulation to know what we’re actually seeing. Revealingly, you won’t find an official U.S. release of this labor-share-of-production measure in dollars or even percent on the Fred data portal — just an index showing its change over time. If you care to go down this theoretical black rabbit hole, some papers here, here, here, and here.
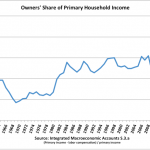
Avoiding all that, here’s a more straightforward question to start with: what percent of household income comes from doing stuff, versus owning stuff — roughly, how much goes to owners vs workers? Here it is based on “primary income” (from the Integrated Macroeconomic Accounts), a measure that seeks to depict households’ market income before taxes and transfers.
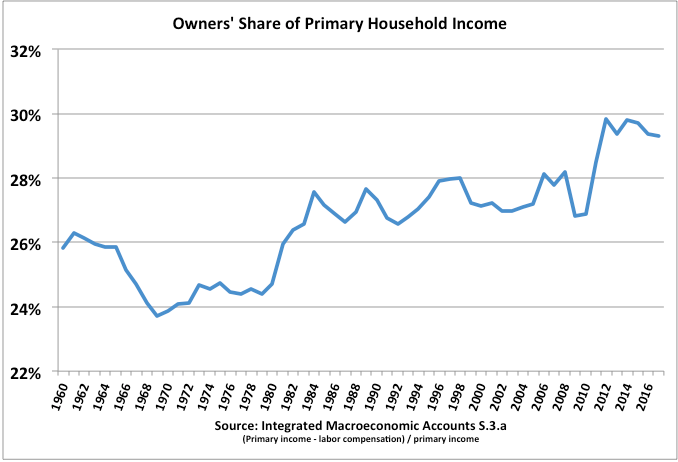
The relative jump in this picture is bigger, from 25% to 30% — a 20% increase. But owners’ income share looks smaller.
But this raises another issue. When economists talk about household income — including this “primary” income measure — they’re talking about a particular stylized accounting definition of “income” that ignores a huge part of…household income: capital gains, or holding gains — money that people, households, families, and dynasties receive and accumulate as wealth over years, decades, and generations.
The thinking is, capital gains aren’t “real” income; they haven’t been “realized,” or they “generate no cash for their owners,” or they’re merely based on “expectations.” Your stock portfolio or home value might go up this year, but go down again next year.
That’s certainly true for any given year — or even three, five, or seven years.
But over any longer period, household capital gains are very, very real income indeed. They deliver very real assets and net worth — wealth — onto household balance sheets, which individuals can easily swap for “cash” when they want to spend, in our liquid financial system. That’s what retirees with nest eggs do — swap their various assets for cash, and “spend down their assets.” (Got lifetime income hypothesis?)
In fact, capital gains are among the main ways that modest households build significant personal nest eggs for retirement and eventually long-term care and bequests to their children (mainly through owning homes), and — especially — the overwhelmingly dominant way that rich households, families, and dynasties, who own most of everything, get rich(er).
This explains why Modern Portfolio Theory investors focus quite sensibly on “total return” including capital gains when building or evaluating their ETF portfolios, not the red herring of yield from interest and dividends — the part of their returns that counts as “income” in national accountants’ and economists’ stylized and incomplete measure. Likewise real estate: how many homeowners could even begin to estimate their annual “income stream” from living in their house? But most can tell you 1. what they paid for it, and 2. what they think it’s worth now. For households, capital gains are very real income. Over years, decades, and lifetimes, they can and do spend that income.
And when you look at a complete picture of comprehensive income including cap gains, you discover a much more extreme picture of income concentration.
But before we get to that, we need to make one more correction. This “primary income” measure is tallied after deducting households’ interest spending (a.k.a. “uses of property income”). Interest outlays are not counted as a use of funds — spending — but as negative income. If you add that back in — because households do receive that income before using it to pay interest — you add about $600 billion a year, roughly 5%, to household income (average, 2009–2016).
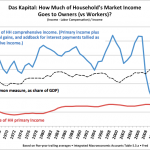
Here’s what the capital/owners’ share of income looks like with those two corrections:

Capital gains are volatile, so this picture is smoothed with simple five-year averages. The other measures are also shown for comparison. The spreadsheet, including data sources, is here.
In the worst five-year period (2007–11) over the last half-century-plus, owners got 25 percent of comprehensive income. Despite protestations about owners “risking” their “capital,” this five-year measure has never gone negative. Over recent decades they’ve often gotten more like 45 or 50 percent+.
Almost all of that ownership income is unearned income, by definition. (Otherwise it would be labor compensation.) It’s received simply for being wealthy: owning stuff like titles to land, and ETF portfolios.
And in the U. S., roughly 60% of that wealth itself — the stuff that accrues income to owners, just for existing — is earned the old-fashioned way: it’s inherited.
It’s pretty hard to square that reality with the widely held view of of prosperous, hard-working makers vs indolent, do-nothing takers. Who’s who?
18 May 2018
Donating = Changing Economics. And Changing the World.
Evonomics is free, it’s a labor of love, and it's an expense. We spend hundreds of hours and lots of dollars each month creating, curating, and promoting content that drives the next evolution of economics. If you're like us — if you think there’s a key leverage point here for making the world a better place — please consider donating. We’ll use your donation to deliver even more game-changing content, and to spread the word about that content to influential thinkers far and wide.
MONTHLY DONATION
$3 / month
$7 / month
$10 / month
$25 / month
You can also become a one-time patron with a single donation in any amount.
If you liked this article, you'll also like these other Evonomics articles...
BE INVOLVED
We welcome you to take part in the next evolution of economics. Sign up now to be kept in the loop!
