


Public goods, services, and transfers boost living standards, reduce insecurity, improve health, and equalize opportunity. But in the course of achieving these valuable goals, do government programs impinge on freedom, weaken civil society, and reduce happiness?
Critics of modern government often assert that they do. “The state can gravely threaten the space for private life,” says Yuval Levin. “It can do so,” he explains, “by invading that space and attempting to fill it, and by collapsing that space under the weight of government’s sheer size, scope, and cost. Both dangers have grown grave and alarming in our time.” Several decades earlier, Milton and Rose Friedman warned of a “major evil” of public social programs: “their effect on the fabric of our society. They weaken the family … and limit our freedom.”
FREEDOM
Because they are funded mainly by taxes, government programs restrict people’s ability to do what they wish with their income, and in this sense government plainly does reduce freedom. By how much? Figure 1 shows effective tax rates in the United States for households at various points along the pretax income distribution. An “effective tax rate” is calculated as taxes paid divided by pretax income. Americans with pretax incomes in the bottom fifth pay, on average, about 20% of their income in taxes. Those with incomes in the middle pay about 27%. Those at the top (in the top 1%) pay about 33%. Whether this constitutes a significant curtailment of freedom is in the eye of the beholder.

Figure 1. Effective tax rates in the United States. Taxes paid as a share of pretax income. The tax rates are averages for the following groups: p0-20, p20-40, p40-60, p60-80, p80-90, p90-95, p95-99, p100 (top 1%). Includes all types of taxes (personal and corporate income, payroll, property, sales, excise, estate, other) at all levels of government (federal, state, local). The data are for 2015. Data source: Citizens for Tax Justice, “Who Pays Taxes in America in 2015?,” using data from the Institute on Taxation and Economic Policy.
The more interesting question is whether government impinges on freedom in other respects. Three are of particular interest.
It is sometimes assumed that a government overseeing an expansive and generous set of public social programs will inevitably also exert a heavy regulatory hand, limiting the freedom of firms and workers to make decisions in pursuit of their interests. Figure 2 shows that, among the world’s rich longstanding-democratic nations, that assumption is wrong. On the vertical axis is each country’s average score for five types of “economic freedom” — the absence of heavy regulation — according to the Heritage Foundation, a conservative think tank. On the horizontal axis is government spending as a share of GDP. Higher-spending nations don’t tend to be heavier regulators.

Figure 2. Government size and light economic regulation. Light economic regulation: average score for business freedom, labor freedom, trade freedom, investment freedom, and financial freedom. Scale is 0 to 100. The data are for 2016. Data source: Heritage Foundation, heritage.org/index. Government expenditures: share of GDP. Includes all levels of government: national, regional, local. Average over 2000-2014. Data source: OECD. “Asl” is Australia; “Aus” is Austria. The correlation is -.11.
What about freedoms for ordinary individuals? Does a big-taxing and -spending government reduce our ability to pursue the kind of life we wish to lead? The Cato Institute, a libertarian think tank, has assembled a “personal freedom index” that measures legal protection, security, freedom of movement, freedom of religion, freedom of association, assembly, and civil society, freedom of expression, and freedom in relationships. Figure 3 suggests no incompatibility between big government and individual liberty.

Figure 3. Government size and personal freedom. Personal freedom: average score for legal protection, security, freedom of movement, freedom of religion, freedom of association, assembly, and civil society, freedom of expression, and freedom in relationships. Scale is 0 to 10. 2012. Data source: Ian Vasquez and Tanja Porcnik, The Human Freedom Index, Cato Institute, 2015, table 2. Government expenditures: share of GDP. Includes all levels of government: national, regional, local. Average over 2000-2014. Data source: OECD. “Asl” is Australia; “Aus” is Austria. The correlation is +.40.
An additional source of information about freedom is public opinion surveys. Since 2005 the Gallup World Poll has asked a representative sample of adults in various countries whether they are satisfied or dissatisfied with their freedom to choose what they do with their life. The vertical axis in figure 4 shows the share responding “satisfied” in each country. As the figure reveals, citizens in countries with heavier government expenditure totals aren’t more likely to see their lives as constrained or limited.

Figure 4. Government size and freedom to make life choices. Freedom to make life choices: share responding “satisfied” to the question “Are you satisfied or dissatisfied with your freedom to choose what you do with your life?” Data source: Gallup World Poll, via the World Happiness Report 2017, online appendix. Government expenditures: share of GDP. Average over 2000-2014. Includes all levels of government: national, regional, local. Data source: OECD. “Asl” is Australia; “Aus” is Austria. The correlation is +.22.
Indeed, government programs often enhance freedom. Anu Partanen’s comparison of her native Finland with her adopted country, the United States, highlights this point. Partanen finds that many Americans don’t have access to high-quality, affordable health insurance, child care, housing in good school districts, college, and senior care. This, she points out, diminishes not only Americans’ security but also their freedom:
“Most people, including myself, assumed that part of what made the United States a great country, and such an exceptional one, was that you could live your life relatively unencumbered by the downside of a traditional, old-fashioned society: dependency on the people you happened to be stuck with. In America you had the liberty to express your individuality and choose your own community. This would allow you to interact with family, neighbors, and fellow citizens on the basis of who you were, rather than on what you were obligated to do or expected to be according to old-fashioned thinking. The longer I lived in America … the more puzzled I grew. For it was exactly those key benefits of modernity — freedom, personal independence, and opportunity — that seemed, from my outsider’s perspective, in a thousand small ways to be surprisingly missing from American life today…. In order to compete and to survive, the Americans I encountered and read about were … beholden to their spouses, parents, children, colleagues, and bosses in ways that constrained their own liberty.”
CIVIL SOCIETY
Another worry about big government is that it will erode or discourage intermediary institutions such as families, voluntary organizations, and perhaps even friendship bonds.
One view about how this plays out is offered by Charles Murray, who links it to happiness:
“Happiness consists of lasting and justified satisfaction with life as a whole…. Once you start to think through the kinds of accomplishments that lead people to reach old age satisfied with who they have been and what they have done, you will find (…) that the accomplishments you have in mind have three things in common. First, the source of satisfaction involves something important. We can get pleasure from trivial things, but pleasure is different from deep satisfaction. Second, the source of satisfaction has involved effort, probably over an extended period of time. The cliche ‘Nothing worth having comes easily’ is true. Third, some level of personal responsibility for the outcome is essential….
“When the government intervenes to help, whether in the European welfare state or in America’s more diluted version, it not only diminishes our responsibility for the desired outcome, it enfeebles the institutions through which people live satisfying lives. There is no way for clever planners to avoid it. Marriage is a strong and vital institution not because the day-to-day work of raising children and being a good spouse is so much fun, but because the family has responsibility for doing important things that won’t get done unless the family does them. Communities are strong and vital not because it’s so much fun to respond to our neighbors’ needs, but because the community has the responsibility for doing important things that won’t get done unless the community does them…. When the government says it will take some of the trouble out of doing the things that families and communities evolved to do, it inevitably takes some of the action away from families and communities….
“Europe has proved that countries with enfeebled family, vocation, community, and faith can still be pleasant places to live. I am delighted when I get a chance to go to Stockholm or Paris. When I get there, the people don’t seem to be groaning under the yoke of an oppressive system. On the contrary, there’s a lot to like about day-to-day life in the advanced welfare states of western Europe. They are great places to visit. But the view of life that has taken root in those same countries is problematic. It seems to go something like this: The purpose of life is to while away the time between birth and death as pleasantly as possible, and the purpose of government is to make it as easy as possible to while away the time as pleasantly as possible — the Europe Syndrome.
“Europe’s short workweeks and frequent vacations are one symptom of the syndrome. The idea of work as a means of self-actualization has faded. The view of work as a necessary evil, interfering with the higher good of leisure, dominates. To have to go out to look for a job or to have to risk being fired from a job are seen as terrible impositions. The precipitous decline of marriage, far greater in Europe than in the United States, is another symptom. What is the point of a lifetime commitment when the state will act as surrogate spouse when it comes to paying the bills? The decline of fertility to far below replacement is another symptom. Children are seen as a burden that the state must help shoulder, and even then they’re a lot of trouble that distract from things that are more fun.”
This is a plausible hypothesis (or set of hypotheses). Let’s start with family. It’s conceivable that by reducing the need to have a partner to help with the breadwinning and childrearing, government services and transfers will cause fewer people to commit to long-term family relationships. But if so, we might expect family to have weakened considerably when universal K-12 schooling (kindergarten, elementary, and secondary) was established, and that didn’t happen. Still, perhaps adding paid parental leave, child care, preschool, a child allowance, and other government supports has pushed the big-government countries past the tipping point.
What do the cross-country data tell us? Marriage isn’t a helpful indicator here. The institution has fallen out of favor in many western European countries, but that doesn’t necessarily mean there are fewer long-term relationships. A better measure is the share of children living in a home with two parents. Figure 5 has this on the vertical axis, with government expenditures as a share of GDP on the horizontal axis. According to this measure, family isn’t weaker in countries with bigger governments.

Figure 5. Government size and two-parent households. Children in two-parent households: share of children age 0 to 14 who live in a household with both a mother and father. 2014. Data source: OECD Family Database, table SF1.3.A. Government expenditures: share of GDP. Includes all levels of government: national, regional, local. Average for 2000-2014. Data source: OECD. “Asl” is Australia; “Aus” is Austria. The correlation is -.12.
For the United States, we have data going back to the early twentieth century for a comparable measure — the share of children living with both of their biological parents at age 16 (and thus likely throughout their childhood). Figure 6 shows the over-time pattern, along with that for government expenditures as a share of GDP. Government size increased steadily from the early 1900s until the mid-1960s. Since then it has continued to grow, but at a much slower pace. During the years in which government size was increasing, the share of children growing up with both parents held steady at about 75%. In the mid-1960s it began to decline, falling to about 55% in the 2010s.
This isn’t what we would expect to observe if big government is a major contributor to family decline. It’s conceivable that government size reached a tipping point around 1960 or 1965, sending family stability on a downward path thereafter even though there was little additional rise in government expenditures. But it seems unlikely that the United States reached such a tipping point given that many countries with bigger governments have more two-parent households (figure 5).

Figure 6. Government size and two-parent households in the United States. Government expenditures: share of GDP. Includes all levels of government: federal, state, and local. The lines are loess curves. Data sources the lower line: for pre-1948, Vito Tanzi, Government versus Markets, Cambridge University Press, 2011, table 1.1; for 1948ff, Economic Report of the President, various years. Data source for the upper line: OECD. Two-parent households: share of children living with both biological parents at age 16. Decade averages. Data source: General Social Survey, sda.berkeley.edu, series family16.
Have people in big-government countries stopped having kids? According to Murray, expansive and generous public social programs foster a culture in which children are seen as a burden and a distraction from the fun things in life. This too turns out to be wrong, as figure 7 shows. Across the rich democratic countries, there is no association between government size and fertility.

Figure 7. Government size and fertility. Fertility rate: average number of children born per woman. 2014. Data source: OECD Family Database, chart SF2.1.A. Government expenditures: share of GDP. Includes all levels of government: national, regional, local. Average for 2000-2014. Data source: OECD. “Asl” is Australia; “Aus” is Austria. The correlation is +.21.
What about participation in voluntary organizations? Yuval Levin contends that “progressive social policy … has sought to make civil society less essential by assigning to the state many of the roles formerly played by religious congregations, civic associations, fraternal groups, and charities, especially in providing help to the poor.” Historically, Americans have been prolific participators. Is that because the United States has fewer and stingier public insurance programs than most other affluent countries? In figure 8 we see a negative association across the rich countries between government spending and the share of adults who say they are an active member of a civic group or organization, but the association is quite weak.
Consider the United States and Sweden, two countries that contrast sharply in the expansiveness and generosity of their public insurance programs. If big government has the effect of quashing or crowding out civic engagement, we ought to observe significantly more participation in civic groups by Americans than by Swedes. The World Values Survey asks about active membership in eight types of groups: religious, sports-recreation, art-music-education, charitable, professional, labor union, environmental, and consumer. Each country has been surveyed three times over the past two decades. It turns out the difference between the two countries is fairly small. When we average across these eight types of groups, 10% of Swedes say they are active members compared to 14% of Americans. And that small difference owes heavily to religious groups, with only 6% of Swedes reporting active membership compared to 36% of Americans.
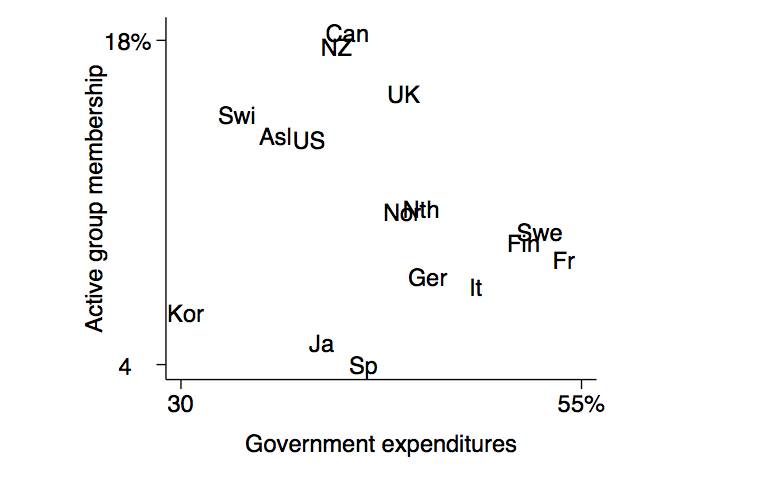
Figure 8. Government size and civic engagement. Active group membership: share of adults who say they are an active member of a civic group or organization. Average for eight types of organization: religious, sports-recreation, art-music-education, charitable, professional, labor union, environmental, consumer. Question: “Now I am going to read off a list of voluntary organizations. For each organization, could you tell me whether you are an active member, an inactive member, or not a member of that type of organization?” The data are for 2005-2014. Data source: World Values Survey, worldvaluessurvey.org. Government expenditures: share of GDP. Includes all levels of government: national, regional, local. Average for 2000-2014. Data source: OECD. “Asl” is Australia. The correlation is -.21.
Robert Putnam has compiled data on membership rates in 32 national chapter-based associations that existed throughout much of the twentieth century in the United States. Figure 9 shows that the era when government expanded the most sharply, between 1915 and 1965, was also was the heyday of rising civic participation. The subsequent decline of civic engagement occurred during a period when government size increased much more slowly.

Figure 9. Government size and civic engagement in the United States. Government expenditures: share of GDP. Includes all levels of government: federal, state, and local. The lines are loess curves. Data sources the lower line: for pre-1948, Vito Tanzi, Government versus Markets, Cambridge University Press, 2011, table 1.1; for 1948ff, Economic Report of the President, various years. Data source for the upper line: OECD. Organization membership: includes the Parent-Teacher Association (PTA), Boy Scouts, Girl Scouts, 4-H, League of Women Voters, Knights of Columbus, Rotary, Elks, Kiwanis, Jaycees, Optimists, American Legion, Veterans of Foreign Wars, the NAACP, B’nai B’rith, Grange, Red Cross, and more. Data source: Robert D. Putnam, Bowling Alone: The Collapse and Revival of American Community, Simon and Schuster, 2000, figure 8.
Government programs surely have some effect of reducing participation in voluntary groups and organizations. But that effect looks unlikely to be very large.
Even if modern big government does crowd out some intermediary organizations, it’s worth asking whether that is bad. Consider safety and property protection. This can be provided by voluntary intermediary organizations, such as local militias. But it’s done more effectively and fairly (because rules assure that everyone gets access to the service, the accused have rights, and so on) by a government police force. Similarly, voluntary “savings clubs” might help to address the problem of people setting too little aside for retirement. But it’s much more effective and efficient to create a government pension program such as Social Security. The point here isn’t that public programs are always better. In some instances they are, and in others they aren’t. The point is that we shouldn’t fetishize civic engagement. Less of it isn’t always a societal loss.
What about family and groups as a source of social support? Yuval Levin suggests that “As the national government grows more centralized, and takes over the work otherwise performed by mediating institutions — from families and communities to local governments and charities — individuals become increasingly atomized.” One measure comes from the Gallup World Poll, which regularly asks “If you were in trouble, do you have relatives or friends you can count on to help you whenever you need them, or not?” The comparative pattern, shown in figure 10, suggests no adverse impact of big government.

Figure 10. Government size and social support. Social support: share responding yes to the question “If you were in trouble, do you have relatives or friends you can count on to help you whenever you need them, or not?” Average over 2005-2016. Data source: Gallup World Poll, via the World Happiness Report 2017, online appendix. Government expenditures: share of GDP. Includes all levels of government: national, regional, local. Average for 2000-2014. Data source: OECD. “Asl” is Australia; “Aus” is Austria. The correlation is -.22 (excluding South Korea).
According to Levin, in the United States “we have set loose a scourge of loneliness and isolation,” partly as a consequence of government expansion and its purported impact on civil society. Yet the most thorough look at available data on isolation and loneliness in the US, by Claude Fischer, concludes that neither has in fact increased.
HAPPINESS
In Charles Murray’s view, big government tends to reduce happiness. According to the hypothesis, this happens partly via a weakening of families and civil society. As we’ve just seen, the evidence doesn’t support this worry.
Another potential pathway is employment. In European nations with cushy welfare states, says Murray, “the idea of work as a means of self-actualization has faded. The view of work as a necessary evil, interfering with the higher good of leisure, dominates. To have to go out to look for a job or to have to risk being fired from a job are seen as terrible impositions.” Here too the data say otherwise. Figure 11 suggests no association between the size of government and the share of the working-age population in paid employment.

Figure 11. Government size and employment. Employment rate: employed persons age 25-64 as a share of the population age 25-64. The data are for 2015. Data source: OECD. Government expenditures: share of GDP. Includes all levels of government: national, regional, local. Average for 2000-2014. Data source: OECD. “Asl” is Australia; “Aus” is Austria. The correlation is -.13.
So Murray’s hypothesized pathways through which big government might reduce happiness — family, civil society, employment — don’t pan out in the real world. Is there, however, a direct effect? If government supports and cushions take too much of the struggle out of life, perhaps we’ll feel too little sense of accomplishment to be genuinely happy.
The first thing to note here is that where government has made life easier, that usually has been a good thing. Think of protection of life and property, clean water, clean air, sewage and trash removal, roads, parks, and schooling, among many others. Second, technological advance and private enterprise have done as much as government, and probably a good bit more, to take the trouble out of life. Few of us any longer grow or hunt our food, make our clothes, build the house we live in, and so on. Nor do we have to walk or ride a horse to get to work, wash clothes and dishes by hand, or go to a library to get answers to important questions.
Still, it’s conceivable that there is a point beyond which happiness might decline because government makes life too easy. Have existing countries reached such a point? Figure 12 suggests they haven’t. The average level of life satisfaction tends to be as high in big-government countries, such as the Nordics, as in those with medium-size governments, such as Switzerland and the United States.

Figure 12. Government size and life satisfaction. Life satisfaction: average score. Scale is 0 to 10. Question: “Please imagine a ladder, with steps numbered from 0 at the bottom to 10 at the top. The top of the ladder represents the best possible life for you and the bottom of the ladder represents the worst possible life for you. On which step of the ladder would you say you personally feel you stand at this time?” Average over 2014-2016. Data source: Gallup World Poll, via the World Happiness Report 2017, online appendix. Government expenditures: share of GDP. Includes all levels of government: national, regional, local. Average over 2000-2014. Data source: OECD. “Asl” is Australia; “Aus” is Austria. The correlation is +.10.
SUMMARY
Do the gains from government goods, services, and transfers come at the cost of reduced freedom, weakened civil society, and diminished happiness? The experience of the world’s affluent democratic countries suggests that, at least so far, the answer is no.
Originally published here.
References
- Lane Kenworthy, “A Decent and Rising Income Floor,” The Good Society; Kenworthy,“Stable Income and Expenses,” The Good Society; Kenworthy, “Economic Security for the Elderly,” The Good Society; Kenworthy, “Health Care,” The Good Society; Kenworthy, “Equality of Opportunity,” The Good Society.
- Yuval Levin, “The Real Debate,” The Weekly Standard, 2012.
- Milton Friedman and Rose Friedman, Free to Choose, Harcourt Brace Jovanovich, 1979, p. 127.
- Vito Tanzi, Government versus Markets, Cambridge University Press, 2011, ch. 1.
- Friedman and Friedman, Free to Choose.
- Anu Partanen, The Nordic Theory of Everything, HarperCollins, 2016.
- Charles Murray, Coming Apart: The State of White America, 1960-2010, Crown Forum, 2012, pp. 254, 282-285.
- Levin, “The Real Debate.”
- Lane Kenworthy, “Civic Engagement,” The Good Society.
- Yuval Levin, The Fractured Republic, Basic Books, 2016, p. 45.
- Levin, The Fractured Republic, p. 88.
- Claude S. Fischer, Made in America: A Social History of American Culture and Character, University of Chicago Press, 2010; Fischer, Still Connected: Family and Friends in America Since 1970, Russell Sage Foundation, 2011; Fischer, Lurching Toward Happiness in America, MIT Press, 2014, ch. 3.
- See also Lane Kenworthy, “Employment,” The Good Society; Kenworthy, “Is Big Government Bad for the Economy?,” The Good Society.
- Some analyses conclude that public social programs increase happiness: Benjamin Radcliff, The Political Economy of Human Happiness, Cambridge University Press, 2013; Christopher J. Anderson and Jason D. Hecht, “Happiness and the Welfare State: Decommodification and the Political Economy of Subjective Well-Being,” in The Politics of Advanced Capitalism, edited by Pablo Beramendi et al, Cambridge University Press, 2015.
Donating = Changing Economics. And Changing the World.
Evonomics is free, it’s a labor of love, and it's an expense. We spend hundreds of hours and lots of dollars each month creating, curating, and promoting content that drives the next evolution of economics. If you're like us — if you think there’s a key leverage point here for making the world a better place — please consider donating. We’ll use your donation to deliver even more game-changing content, and to spread the word about that content to influential thinkers far and wide.
MONTHLY DONATION
$3 / month
$7 / month
$10 / month
$25 / month
You can also become a one-time patron with a single donation in any amount.
If you liked this article, you'll also like these other Evonomics articles...
BE INVOLVED
We welcome you to take part in the next evolution of economics. Sign up now to be kept in the loop!
